
Review period: September 9, 2025 to September 9, 2026. Scenario horizon: September 9, 2027.
A year ago, GPT-5 was already a serious reasoning and coding system. It could use tools, work through multistep instructions, and solve substantial software problems. Any account that reduces last year's AI to a chatbot answering simple questions understates the starting point. [S01]
The more useful question is how much the scope, quality, and reliability of delegated work have changed.
Consider one measurable shift. The reported GPQA Diamond score for GPT-5 at high reasoning effort was 85.7%. Astra's published score is 96.0%. That is a gain of 10.3 percentage points. Expressed as remaining benchmark error, the movement from 14.3% to 4.0% represents a reduction of approximately 72%. Those are calculations from published endpoints, rather than a controlled experiment with identical computing budgets. [S05, S11]
That distinction runs through this review. VERIFIED means the claim appears in the cited primary source. Model benchmark reruns and production workflows remain UNTESTED in this analysis. Calculated future scenarios are ESTIMATED, their possible workplace implications are INFERRED, and unsupported capabilities remain UNKNOWN.
The release history centers on OpenAI because the comparison ends with GPT-6 Astra. Independent METR research supplies context for longer-term capability growth. This is a selected, one-year progression, rather than an exhaustive census of the AI industry.
The timeline: eight advances after an already capable starting point
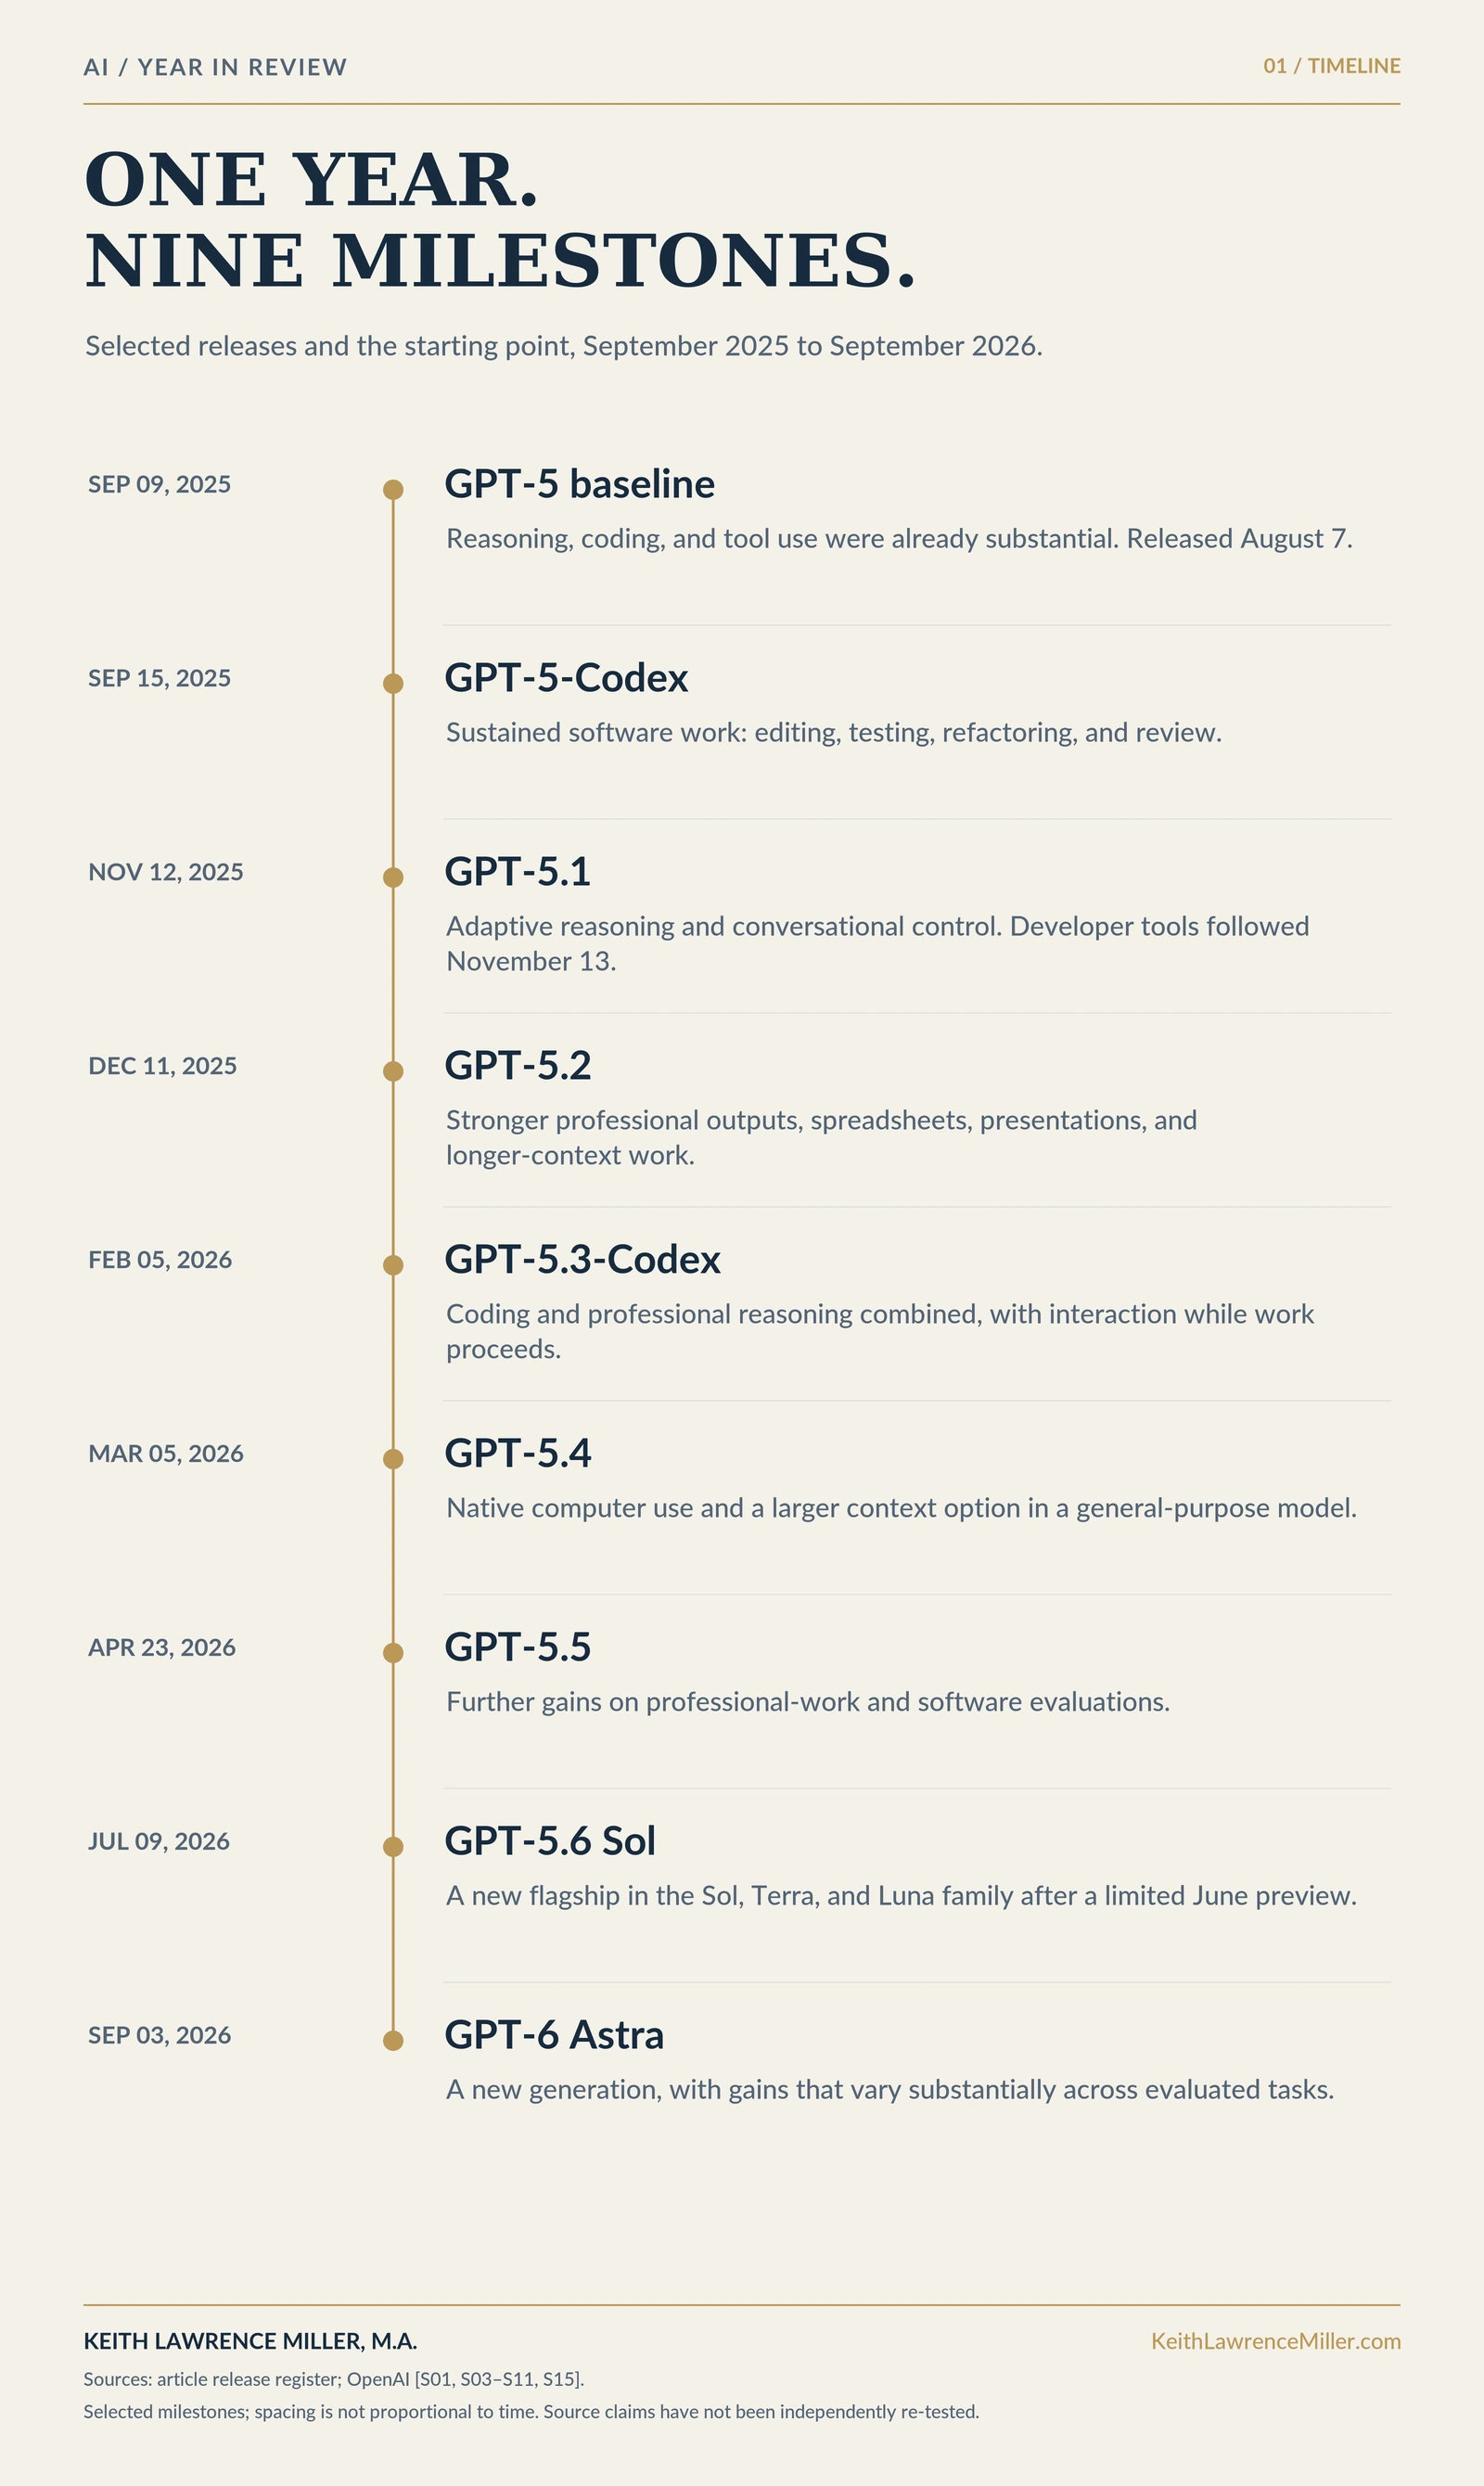
September 2025: GPT-5 establishes the baseline. Released on August 7, GPT-5 was available when this review window opened. Its launch reported 74.9% on a 477-problem SWE-bench Verified subset. A later, all-500-problem comparison reported 72.8%. Both numbers have legitimate contexts; switching between them without noting the denominator would distort the comparison. [S01, S05]
September 15, 2025: GPT-5-Codex specializes in sustained software work. The emphasis shifted toward iterative code editing, testing, refactoring, and review inside a coding environment. The important progression was the ability to remain involved across multiple stages of a development assignment. [S03]
November 12–13, 2025: GPT-5.1 makes reasoning more adaptive. The ChatGPT release emphasized better conversational control and a more flexible allocation of reasoning effort. The developer release added dedicated patching and shell tools. Together, those changes addressed the practical problem of spending appropriate effort on a task while interacting with the environment needed to complete it. [S04, S05]
December 11, 2025: GPT-5.2 strengthens professional output. OpenAI emphasized spreadsheets, presentations, longer-context work, and professional tasks. Its published original GDPval win-or-tie rate reached 70.9%, compared with 38.8% for GPT-5 in that comparison. The evaluated deliverable became an increasingly important unit of progress. [S06]
February 5, 2026: GPT-5.3-Codex combines coding and professional reasoning. OpenAI described a model integrating the strengths of its earlier coding and general reasoning systems, with users able to interact while work proceeded. The company reported a 25% speed improvement over its predecessor in the specified Codex comparison. That was a particular release-level claim, rather than a universal measure of AI speed. [S07]
March 5, 2026: GPT-5.4 brings native computer use into a general-purpose model. OpenAI introduced native computer-use capabilities in its general-purpose model for API and Codex use, alongside a much larger context option. This widened the interface between reasoning and action: software environments themselves could become part of the assignment. [S08]
April 23, 2026: GPT-5.5 advances the same professional-work measures. Its original GDPval result rose to 84.9%, compared with 83.0% for GPT-5.4. The increment was smaller than earlier gains. That matters: progress across releases does not follow one uniform slope. [S09]
July 9, 2026: GPT-5.6 Sol becomes the flagship in a broader family. Following a limited June preview, Sol arrived alongside Terra and Luna. The release continued the focus on professional work, long-context performance, and software tasks while offering different model sizes and operating tradeoffs. [S10]
September 3, 2026: GPT-6 Astra opens a new generation. The safety documentation accompanying the new generation underscores that deployment safeguards remain integral to the release. [S15]
Interpretation: The sequence suggests a widening scope of delegation. More of an assignment can be handled within an integrated model-and-tool workflow. The remaining question is how reliably that workflow reaches an acceptable result.
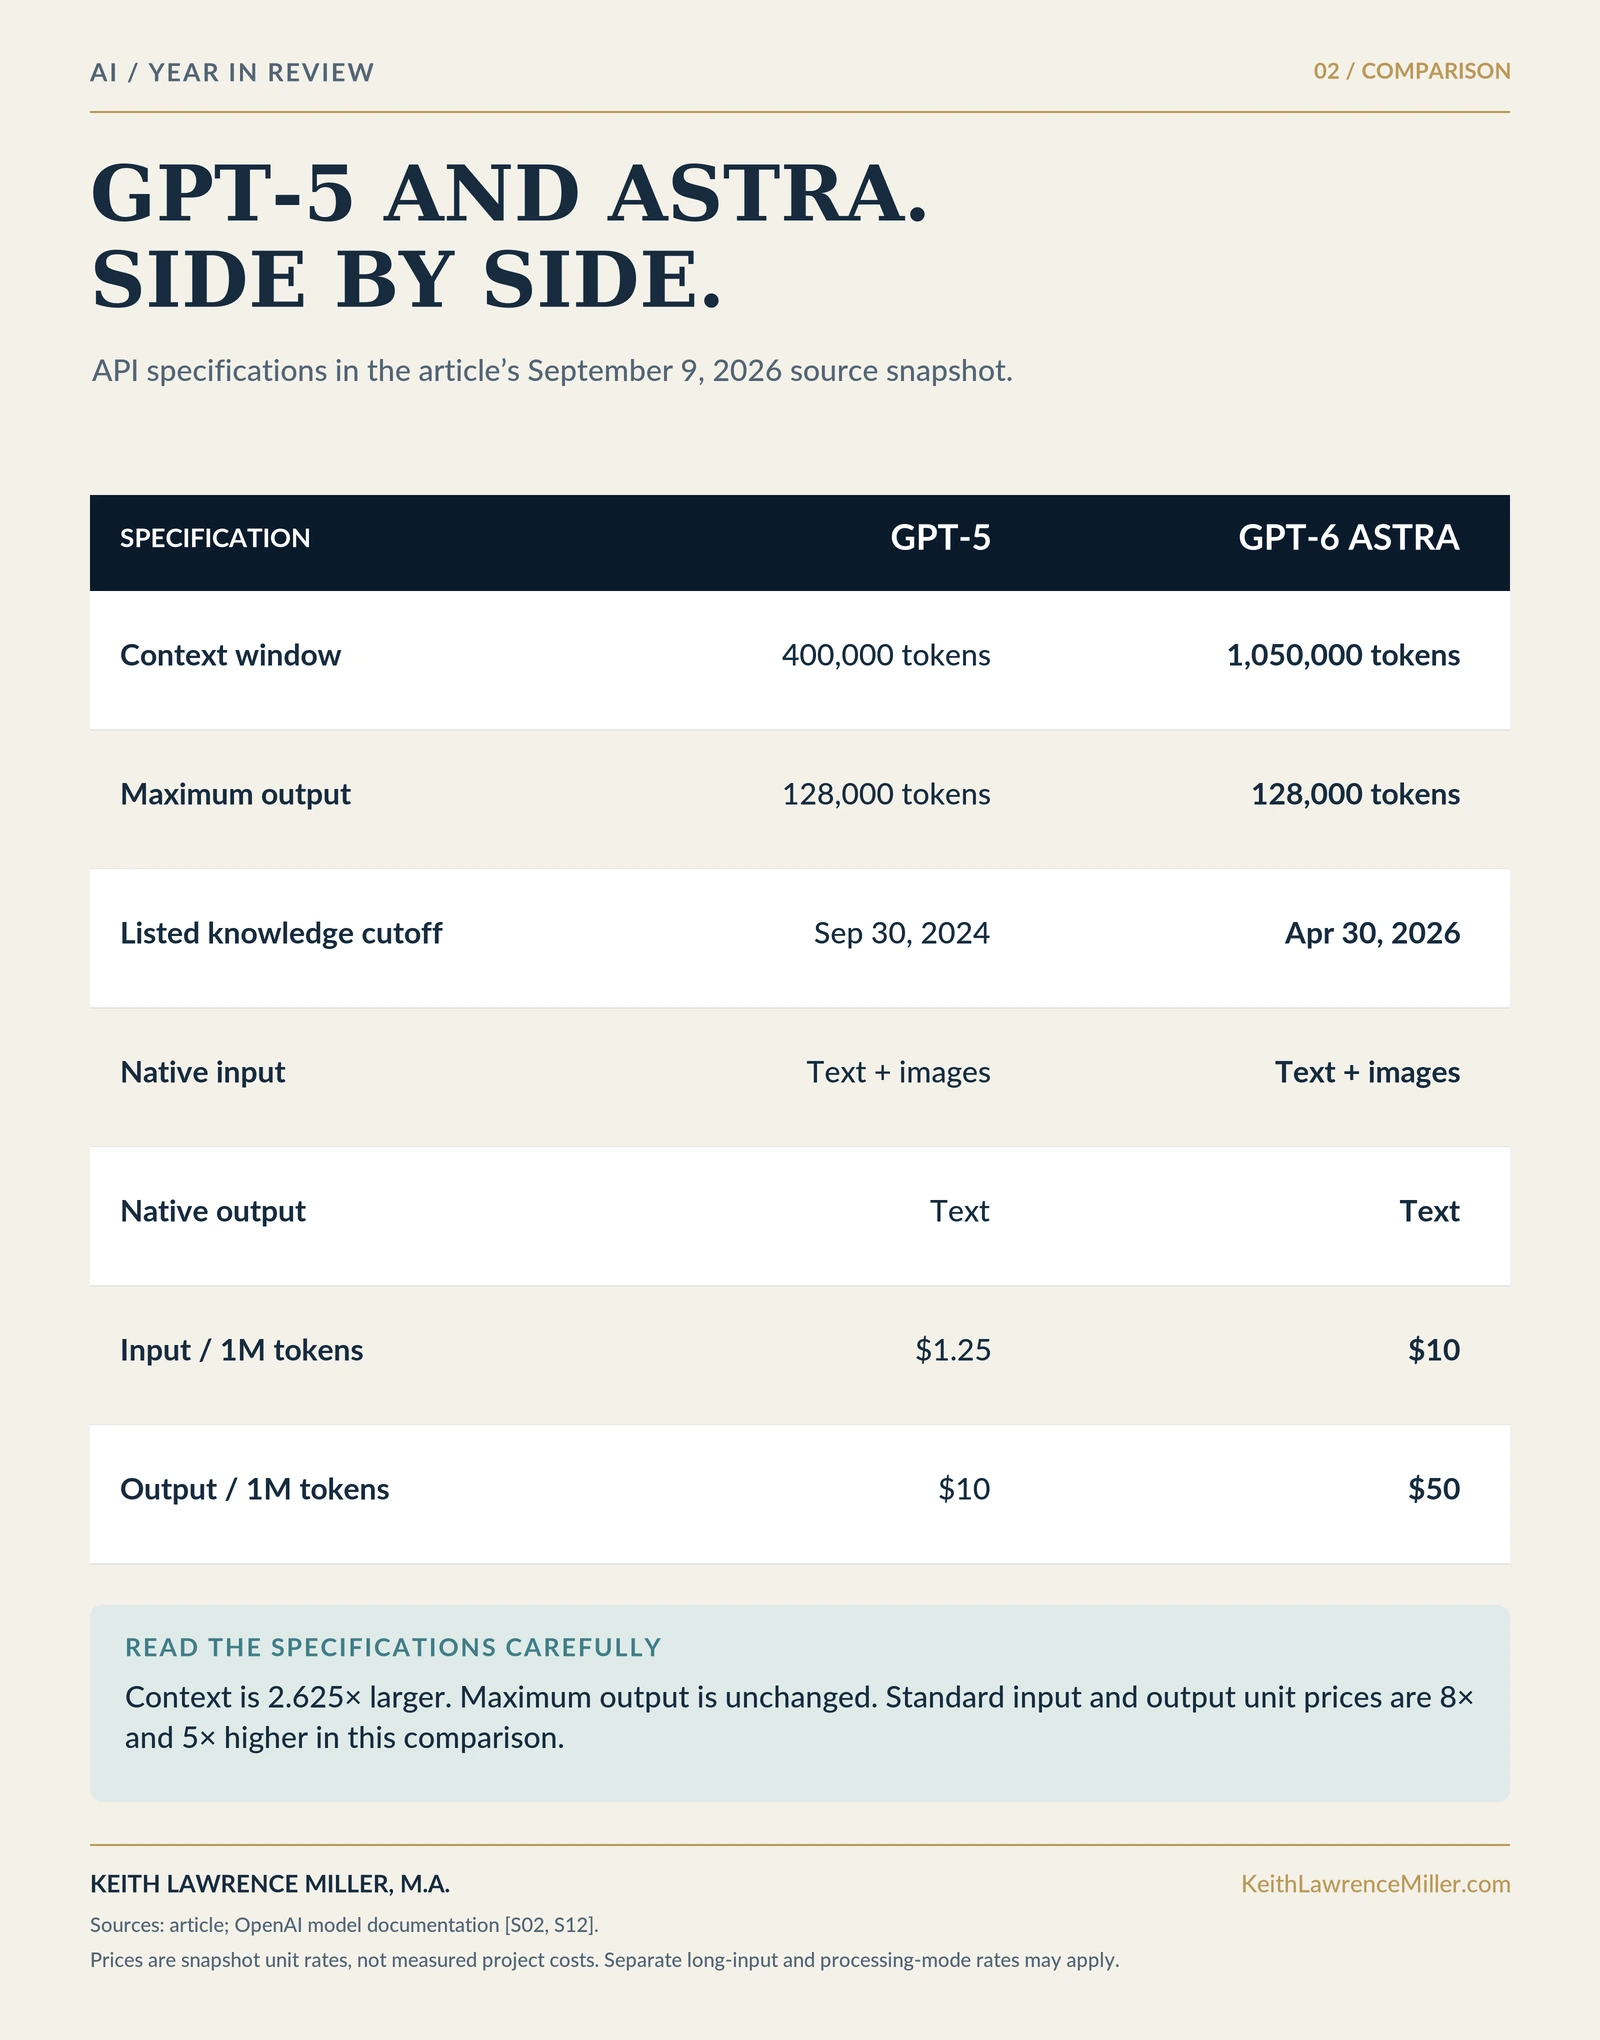
GPT-5 and Astra, side by side
A useful comparison separates specifications, evaluation results, and application behavior. They measure different things.
| Published API specification | GPT-5 | GPT-6 Astra |
|---|---|---|
| Context window | 400,000 tokens | 1,050,000 tokens |
| Maximum output | 128,000 tokens | 128,000 tokens |
| Listed knowledge cutoff | September 30, 2024 | April 30, 2026 |
| Native input | Text and images | Text and images |
| Native output | Text | Text |
| Standard input price per million tokens | $1.25 | $10 |
| Standard output price per million tokens | $10 | $50 |
Sources: official model documentation, checked September 9, 2026. These are currently listed prices for the two models, not a historical price series, measured project costs, or ChatGPT subscription charges. Astra has separate long-input and processing-mode rates. [S02, S12]
The context window is 2.625 times larger, while maximum output is unchanged. Input and output unit prices in this comparison are 8 times and 5 times higher, respectively. Those calculations challenge any assumption that every aspect of frontier AI improves in the same direction. [S02, S12]
A larger context window permits more material within a request. It does not, by itself, establish permanent memory, flawless recall, or mastery of everything supplied. Likewise, a more recent knowledge cutoff does not establish that an answer is current; live verification remains a separate requirement.
Unit price also cannot establish cost per successful assignment. That calculation needs actual token usage, retries, tool charges, human review, and the percentage of outputs accepted. Cost per accepted task is UNKNOWN here because those quantities were not measured.
The year-over-year benchmark view
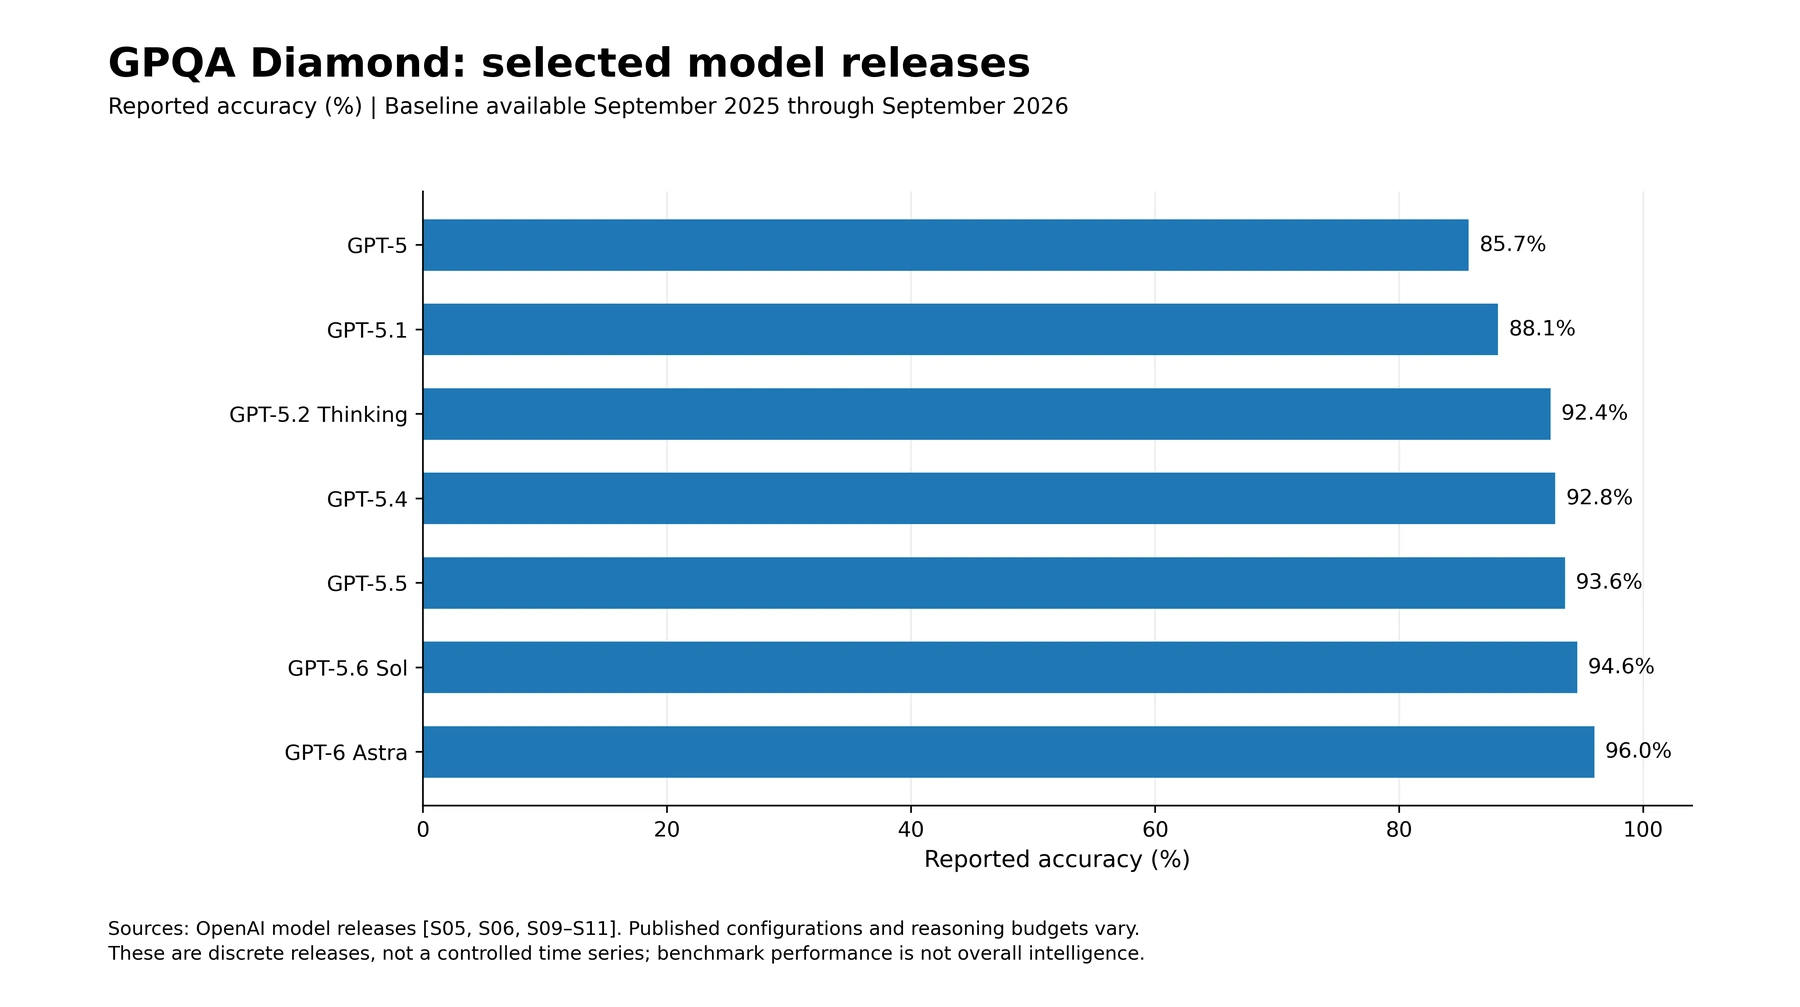
The distinction between score gain and error reduction is important. A move near the top of a bounded scale can look modest in percentage points while removing a large fraction of the errors that remain. Neither calculation produces a general-purpose intelligence multiplier.
Model selection matters, too. GPT-5 Pro's launch GPQA result was 88.4%; using that more capable baseline would yield about a 65.5% reduction in remaining error, rather than 72%. The main series uses the published GPT-5 high-effort baseline and Astra's reported result, not a Pro-to-Pro comparison. [S01, S05, S11]
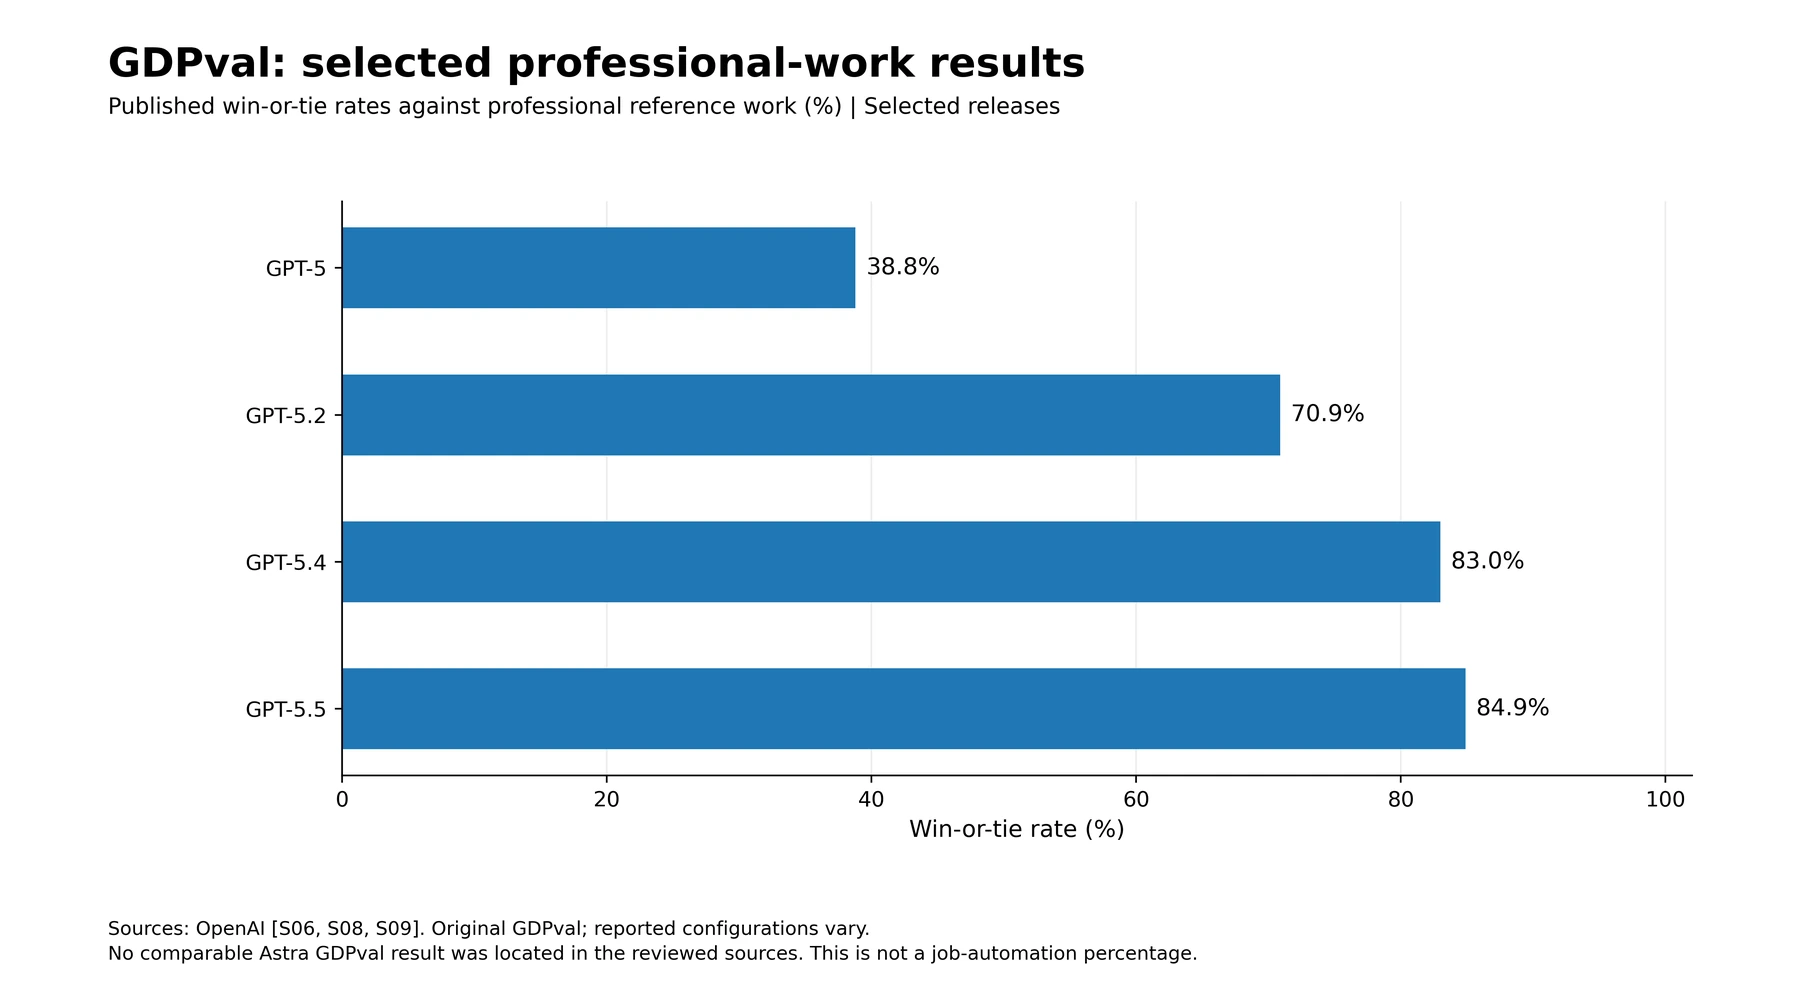
The rise from 38.8% to 84.9% is 46.1 percentage points. A directly comparable Astra score for original GDPval, and an Astra SWE-bench Verified score, were not located in the sources reviewed for this article. Those cells remain unfilled rather than being replaced with newer, differently defined tests.
Astra's most recent leap varies sharply by task
The cleanest recent comparison uses Sol and Astra scores from the same release table, preserving benchmark versions and evaluation context.
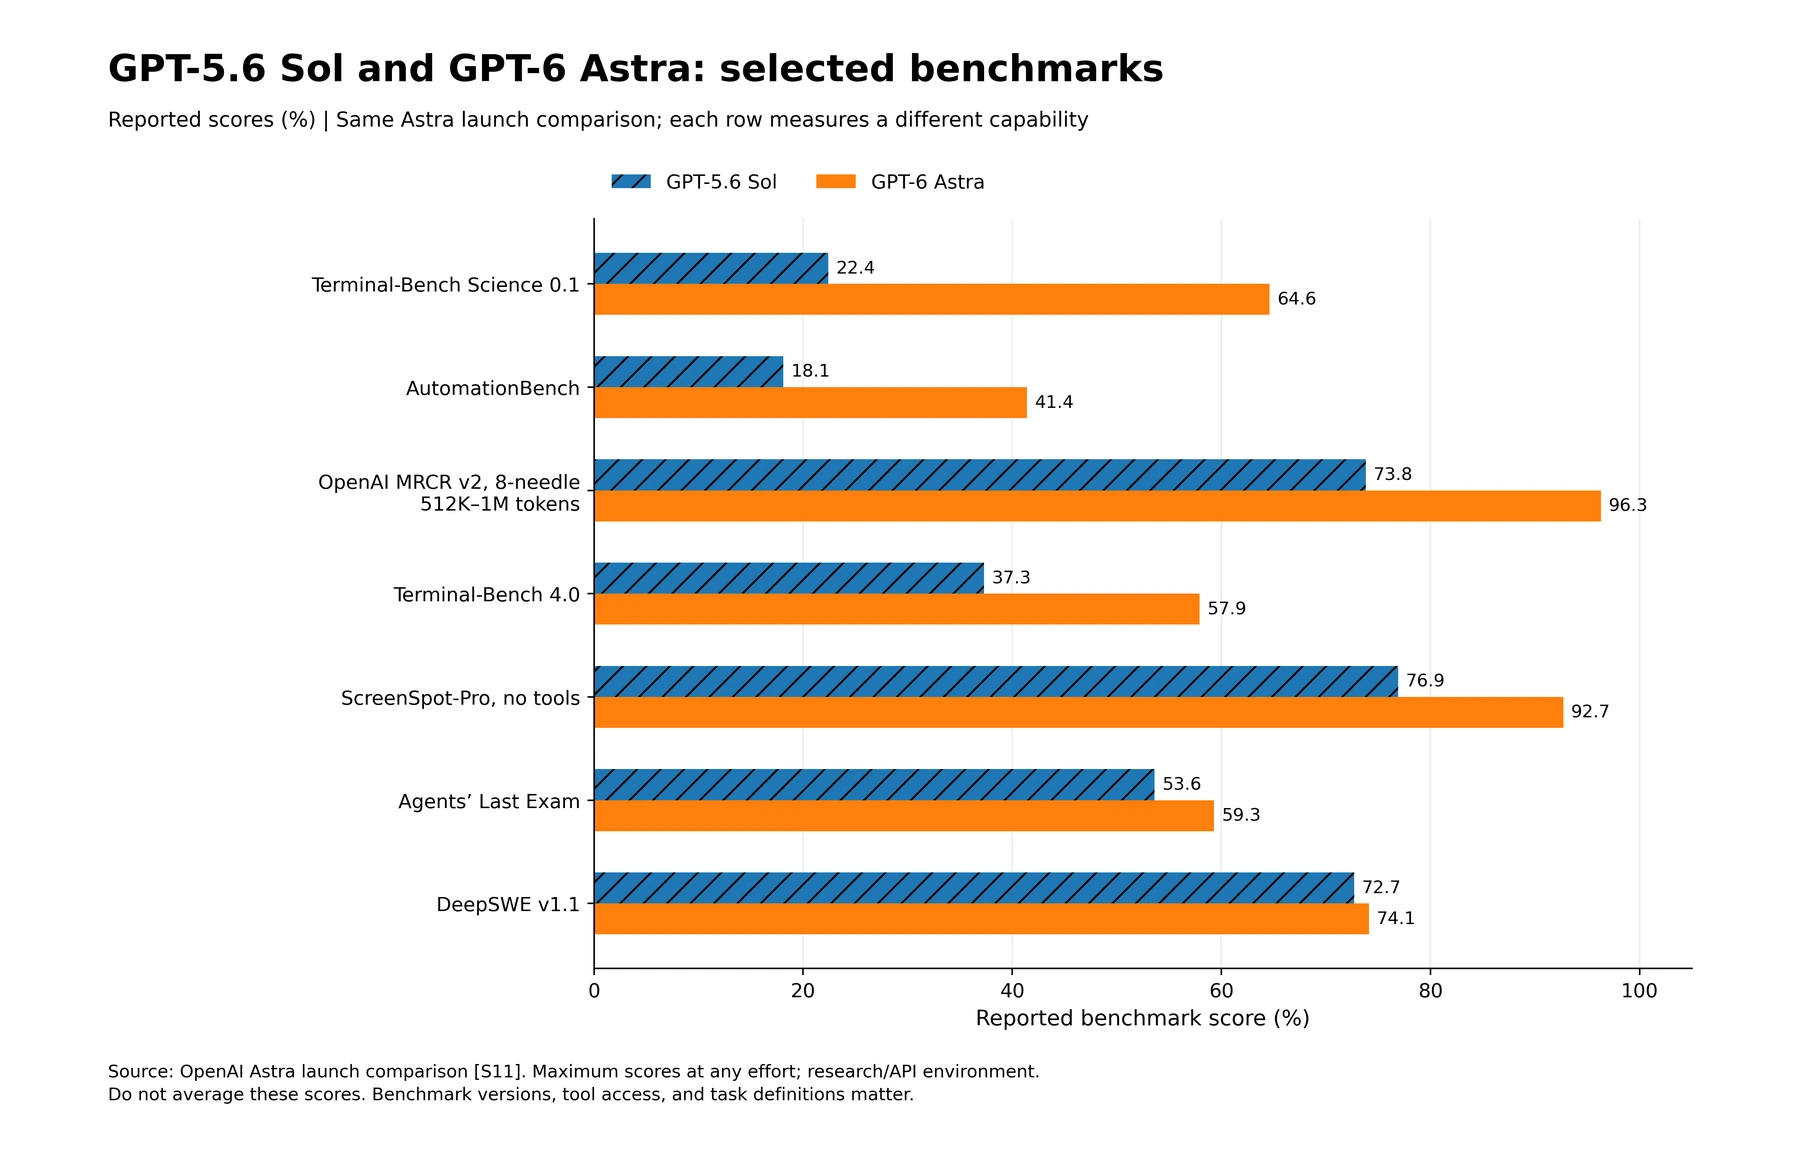
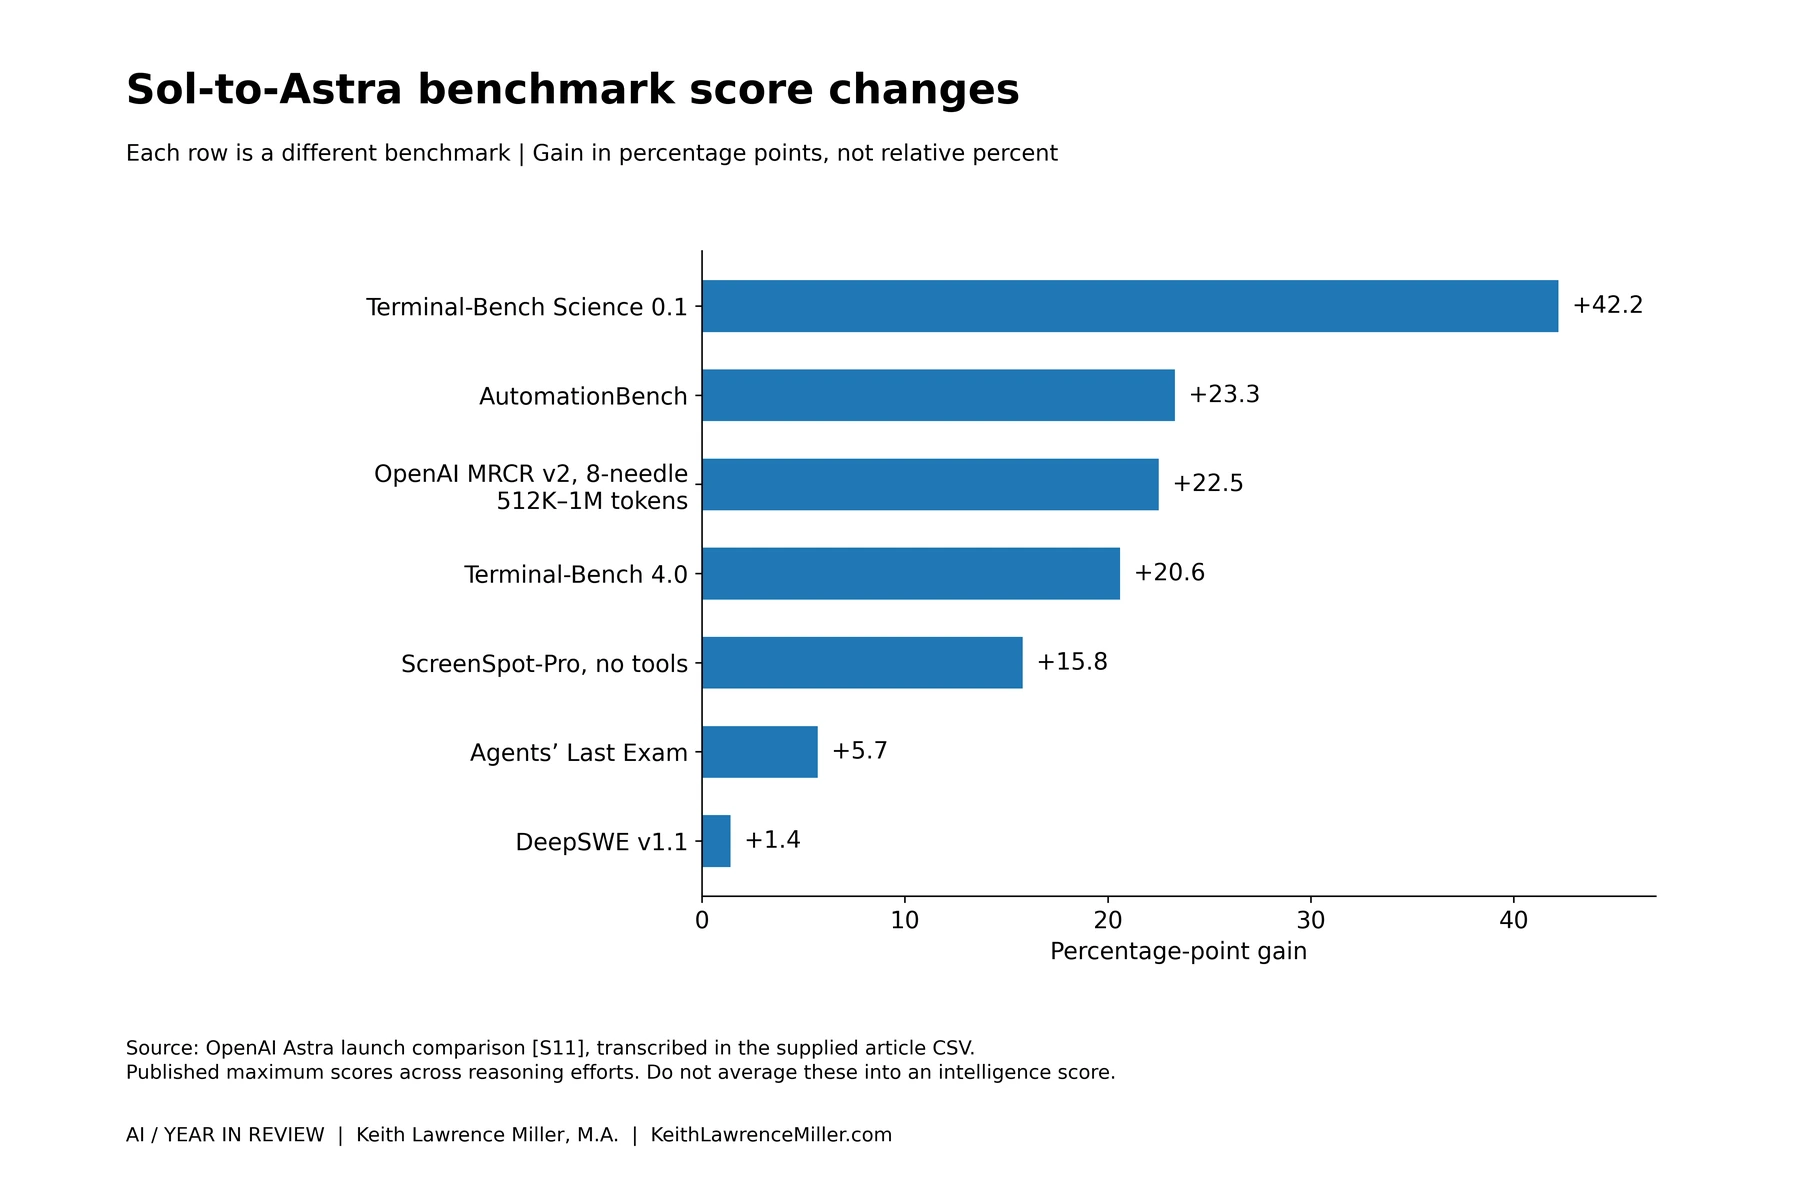
The largest and smallest changes are deliberately shown together. The increase is 42.2 percentage points on Terminal-Bench Science 0.1 and 1.4 points on DeepSWE v1.1. Their difference argues against treating progress as a uniform multiplier.
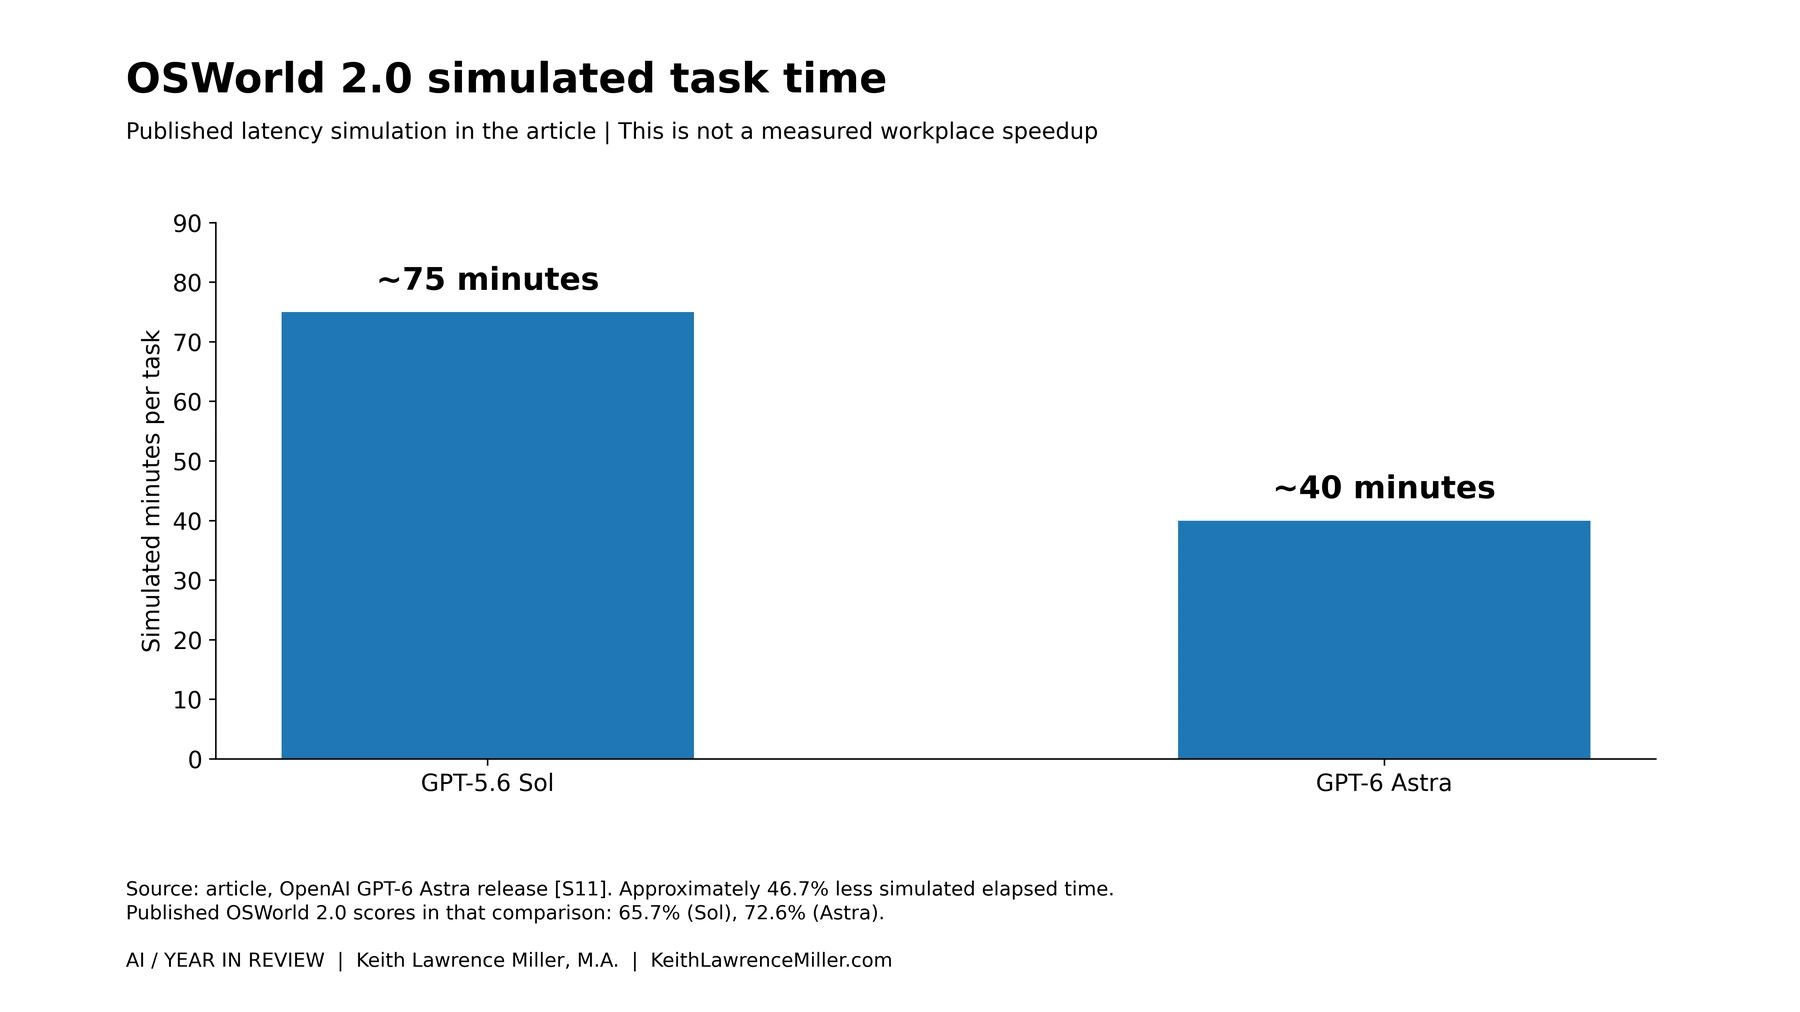
There is also a specific speed result: OpenAI reports OSWorld 2.0 latency simulations of roughly 75 minutes per task for Sol and 40 for Astra, alongside scores of 65.7% and 72.6%. That is approximately 47% less simulated elapsed time, with higher benchmark performance. It is not a measured speedup for the reader's workflow. [S11]
Different benchmark versions cannot fill gaps in the timeline. Terminal-Bench 2.0 and Terminal-Bench 4.0 are different tests; OSWorld Verified and the OSWorld 2.0 offline subset also differ. A lower numerical result on a newer test would not establish that a model had regressed. [S09, S11]
The practical shift: more of the workflow stays connected
The developer documentation describes asynchronous tool calls and mid-turn steering: applications can coordinate pending work while users redirect an ongoing task. The application still has to execute tools, return results, and manage the workflow. A documented capability does not prove that a particular integration is configured correctly. [S13]
For a business, the useful hypothesis is that fewer handoffs could be needed between reading source material, performing analysis, creating an output, and checking it. That hypothesis needs testing on the organization's own work.
A vendor-published Legora case study illustrates why specificity matters. It reports nearly 40% improvement on a financial-statement-review workflow, while the gain across the broader BAR task set was about 3%. The larger result describes a particular workflow; it should not be generalized to all legal work. [S16]
Playco's published experience describes game prototyping and a reduction in manual fixes. That is evidence about a specific customer's integration and testing, rather than an independently controlled estimate of productivity across developers. [S17]
These examples suggest a practical evaluation question: How much work reaches acceptance after accounting for human correction? That measure would distinguish an impressive demonstration from a repeatable operating advantage.
Projecting the next year requires two different kinds of mathematics
There is no defensible single growth rate for all AI capabilities in the evidence above. Accuracy is bounded by 100%. The size of a task handled at a fixed success threshold has a different scale. Mixing them would create misleading forecasts.
This article therefore uses two scenario models. One repeats the observed reduction in remaining GPQA error. The other applies a historical task-horizon growth rate from METR. Neither is a forecast with assigned probabilities.
Scenario model 1: repeat the reduction in remaining errors
Start with the published GPQA endpoints: 14.3% error for the GPT-5 baseline and 4.0% for Astra. The remaining-error multiplier is:
4.0 ÷ 14.3 = 0.2797.
Repeating that proportional reduction for another year would leave approximately 1.12% error, equivalent to 98.88% accuracy. Repeating the improvement process at twice or three times the rate gives:
| September 2027 scenario | Implied GPQA accuracy | Remaining error |
|---|---|---|
| Same error-reduction rate | 98.9% | 1.12% |
| 2× error-reduction rate | 99.7% | 0.31% |
| 3× error-reduction rate | 99.9% | 0.09% |
Formula: future accuracy = 100 − 4 × (4/14.3)^a, where a is 1, 2, or 3. These are original calculations from the cited reported endpoints. [S05, S11]
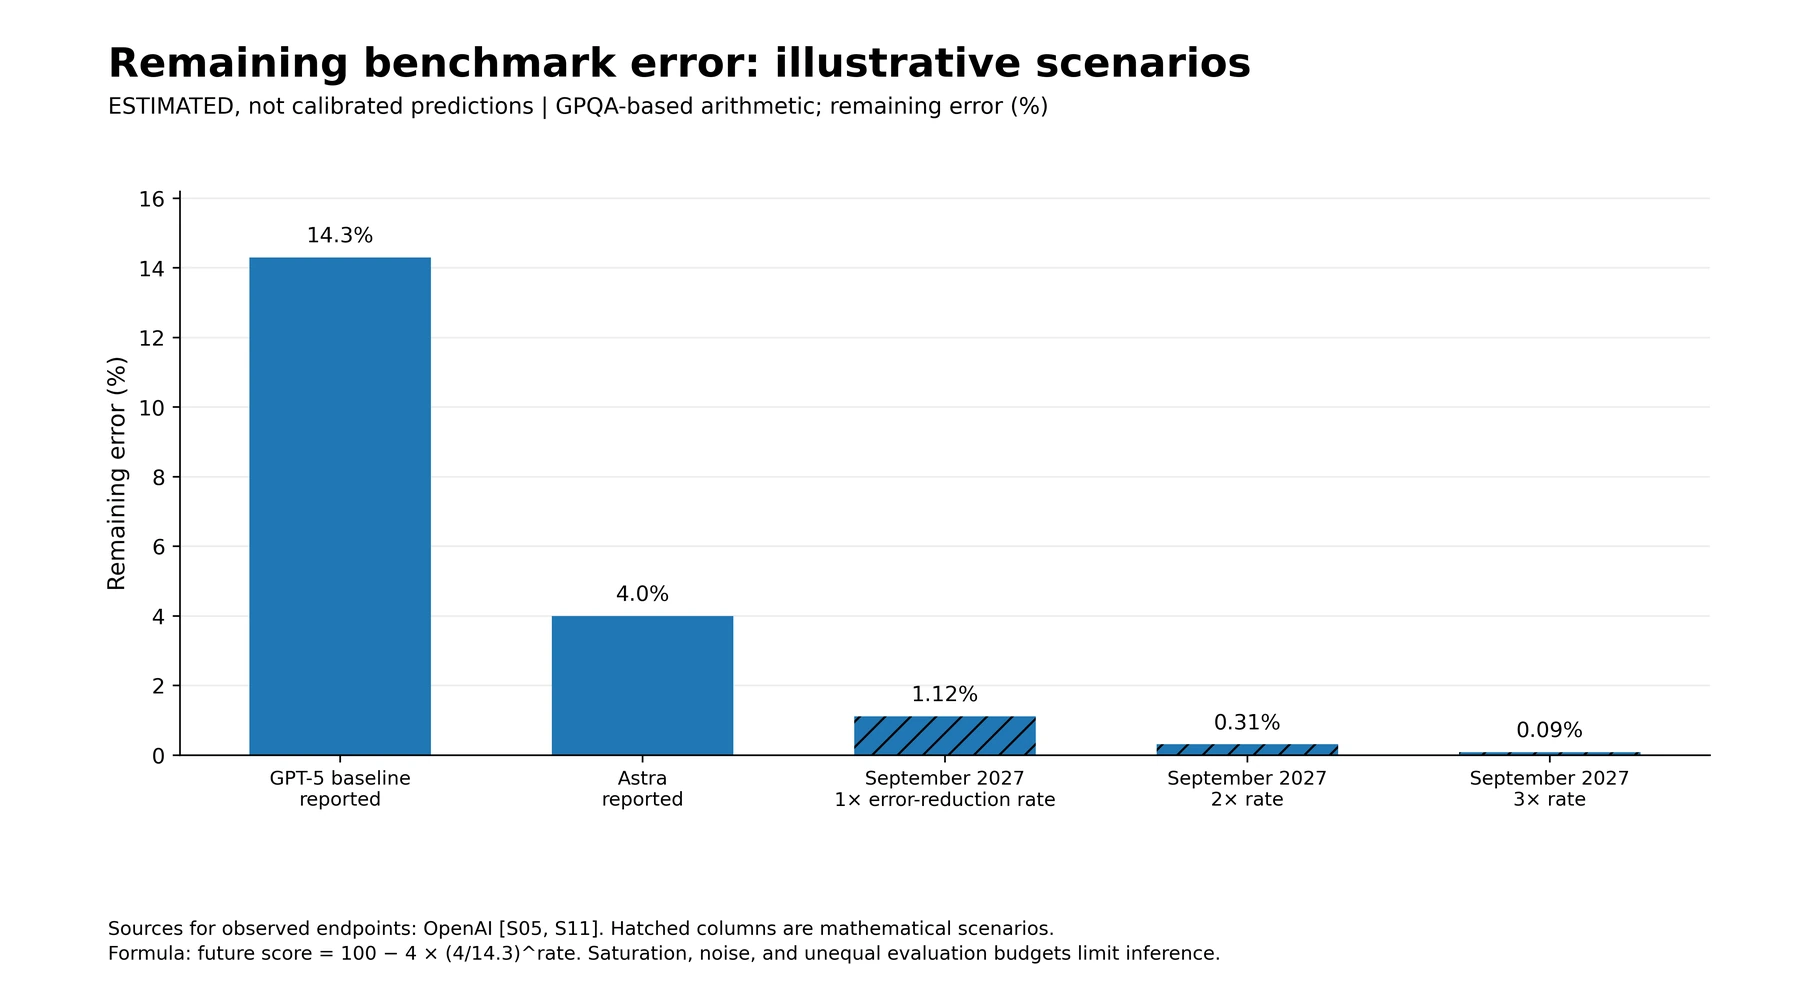
Adding another 10.3 percentage points to 96% would produce an impossible 106.3%. Modeling the remaining error avoids that mathematical mistake. It does not remove uncertainty about evaluation noise, computing budgets, benchmark saturation, or the difficulty of the remaining questions.
Status: ESTIMATED illustration. The exercise shows how a bounded metric could evolve under a specified rule. It does not establish that a September 2027 model will attain these results.
Scenario model 2: compound the size of tasks AI can handle
METR's task horizon estimates the human-expert duration of tasks that an AI system can complete at a specified success probability. A 50%-success horizon is not the amount of time a model runs unattended, and it is not a production reliability guarantee. [S18]
METR's January 2026 update described a long-run, hybrid historical trend with a doubling time of approximately 196 days. More recent subsets produced faster estimates: roughly 131 days since 2023 and 89 days since 2024. That sensitivity is a warning against treating one fitted rate as a law of nature. [S19]
The scenario below uses the rounded 196-day historical reference. It is not a new fit to September 2025–September 2026 data, and it is not an independently measured Astra trend.
Normalize the September 9, 2026 starting level to 1.0. Then:
Future task horizon ÷ starting horizon = 2^(a × days/196).
Here, a multiplies the rate of improvement. At 2× the rate, the doubling time halves; at 3×, it falls to one-third.
| Scenario | Assumed doubling time | September 2027 multiple |
|---|---|---|
| Slowdown: half the reference rate | 392 days | 1.9× |
| Historical reference rate | 196 days | 3.6× |
| 2× improvement rate | 98 days | 13.2× |
| 3× improvement rate | About 65 days | 48.1× |
Original 365-day scenario calculations, using the historical reference from METR. No probabilities are assigned. [S19]
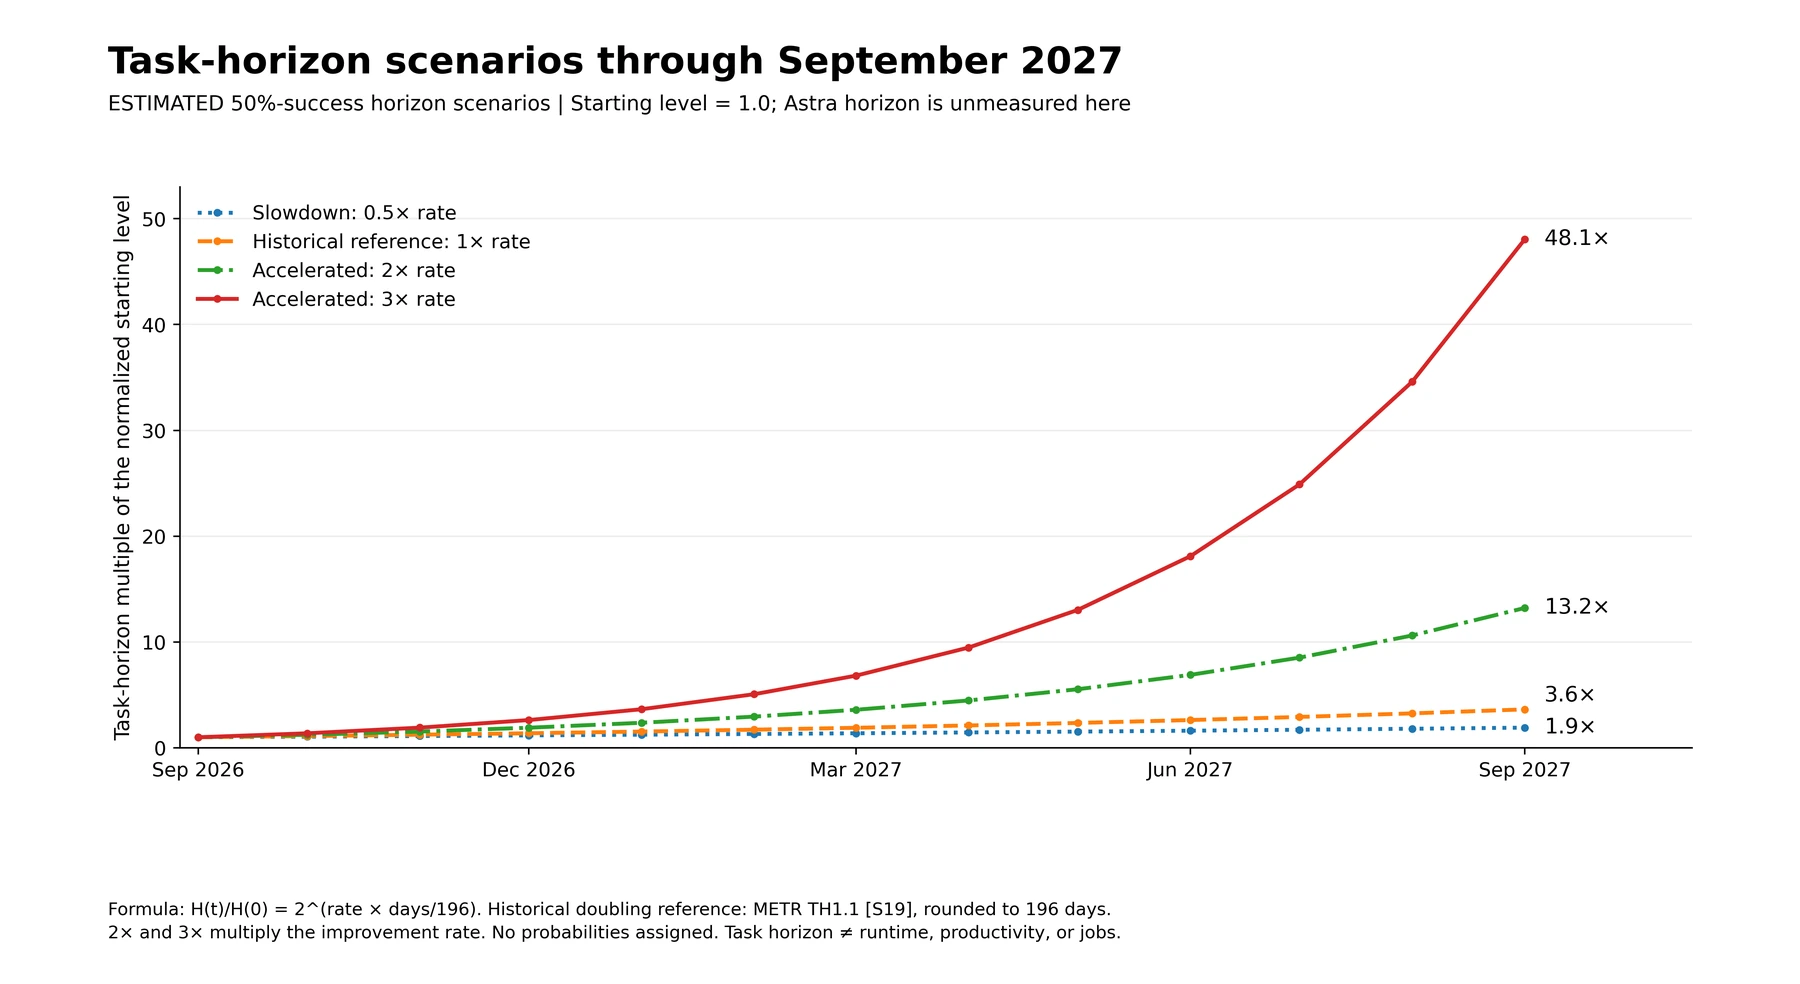
That distinction explains the large numbers. Doubling the annual improvement rate produces much more than twice the ending capacity when growth compounds. Simply assuming “twice as capable next year” would instead be a 2.0× endpoint, a different scenario.
48.1× task horizon does not mean 48.1× employee output, revenue, intelligence, or job displacement. METR cautions about extrapolating from self-contained technical tasks to broader work and about measurement limits for very long tasks. Its reviewed dashboard also warns that estimates above 16 hours are unreliable with the existing task suite. An independent Astra horizon was not located in the reviewed evidence. [S18, S20]
What could those scenarios mean by September 2027?
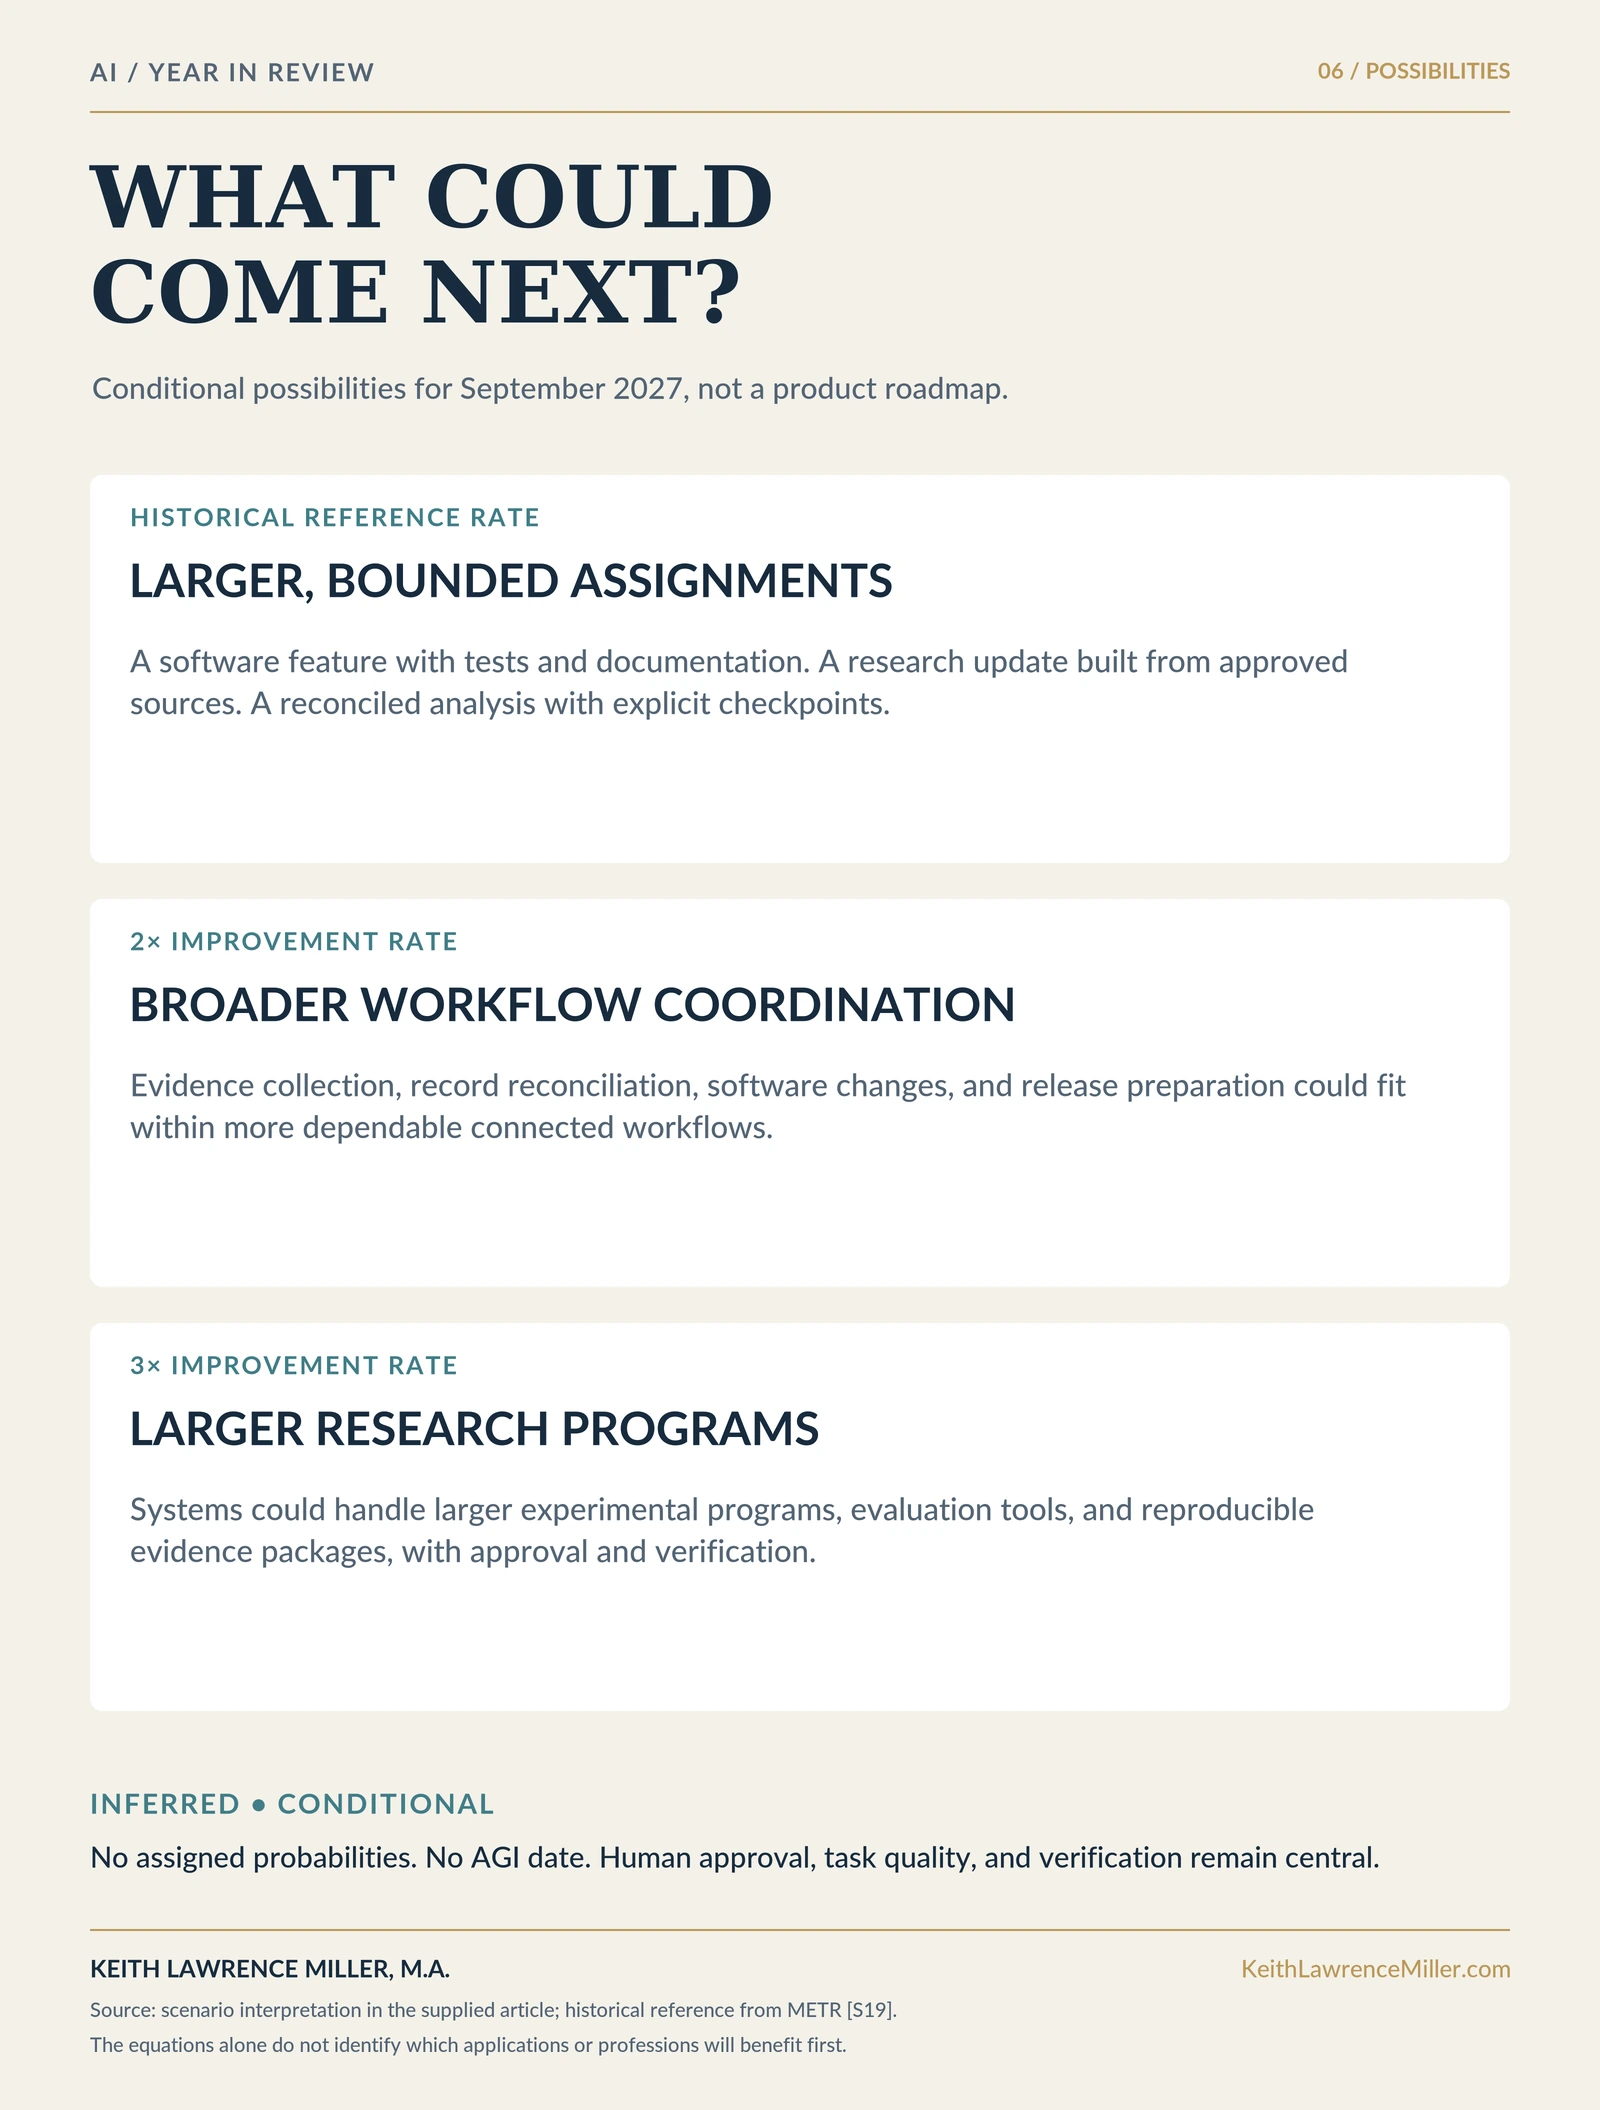
The following are INFERRED possibilities, conditional on capabilities transferring to practical environments. The equations do not identify which professions, applications, or organizations will benefit first.
Historical-reference scenario: larger assignments with explicit checkpoints
A plausible development would be better completion of bounded work packages: a software feature with tests and documentation; a research report refreshed from approved sources; or an analysis that reconciles inputs, produces a spreadsheet, and explains exceptions.
The key change would be the amount of coherent work completed before a person needs to intervene. Human approval would still matter for publication, consequential decisions, financial commitments, and changes to production systems.
The test would be straightforward: can the system finish a larger assignment at the same quality threshold while requiring less correction? This scenario does not require an autonomous company or a claim that entire occupations have disappeared.
2× acceleration scenario: broader coordination across workflows
At twice the historical improvement rate, a possible frontier would be more dependable coordination across several connected workstreams: gathering evidence, reconciling records, modifying software, testing changes, and preparing a reviewable release package.
Specialist agents could divide the work while a coordinating system maintains requirements and checks dependencies. The principal uncertainty would be whether failures between steps decline fast enough to support longer assignments.
The scenario's 13.2× horizon multiplier would still describe performance at the selected benchmark threshold. A business would need separate evidence before interpreting it as dependable end-to-end execution.
3× acceleration scenario: a much larger software and research frontier
The aggressive scenario raises the possibility of systems handling much larger experimental programs: designing tests, building evaluation tools, examining results, correcting implementation problems, and assembling reproducible evidence for researchers or engineers.
Such systems could also help improve the tooling used to develop and evaluate later AI systems. That is a conditional feedback mechanism worth monitoring. The extrapolation supplies no proof of autonomous recursive self-improvement, no date for AGI, and no justification for removing oversight.
At this rate, the challenge would include inventing harder, better-grounded evaluations. A rapidly rising curve is useful only while the measurement continues to distinguish real capability from favorable test conditions.
Reliability could matter more than another dramatic headline score
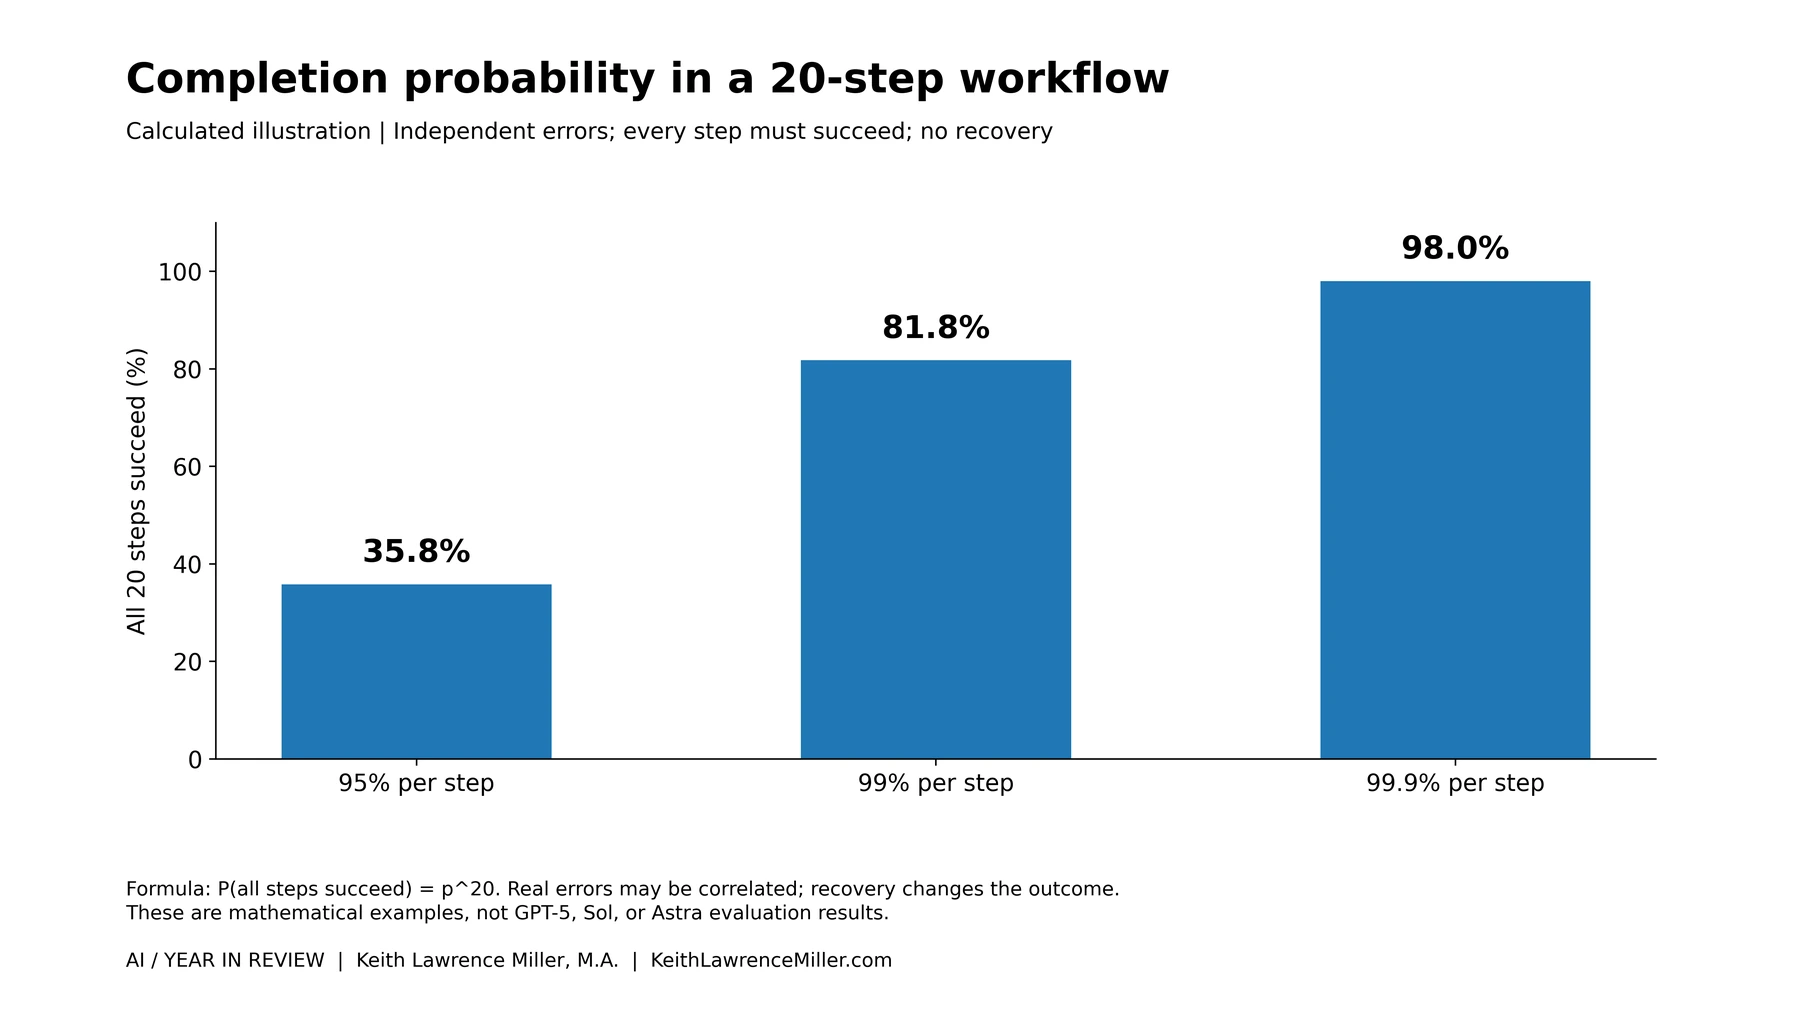
A simple hypothetical shows why small improvements at each step can matter enormously across a workflow.
Suppose an assignment contains 20 necessary steps, with independent errors and no recovery. If each step succeeds 95% of the time, the probability of all 20 succeeding is approximately 35.8%. At 99% per-step reliability, it rises to 81.8%. At 99.9%, it reaches 98.0%.
These are arithmetic illustrations, not measured model results. Real errors can be correlated, and verification or recovery can change the outcome. The example explains why workflow evaluation should track completion, correction, and failure recovery rather than fluency alone.
Security also requires its own measurement. Astra's system card reports lower attack success on a Gray Swan indirect prompt-injection evaluation: 27.0% for Sol and 8.5% for Astra, using an at-least-one-success-over-15-attempts measure. Those are evaluation results, not production incident rates. The safety overview simultaneously reports concerns about reduced monitorability in certain tests. Greater capability does not settle every safety question. [S14, S15]
The productivity evidence also deserves restraint. METR's survey of 349 technical workers reported median self-assessed work-value increases of roughly 1.4× to 2× and self-reported speed around 3×. The research explicitly discusses selection and self-report limitations. Those measures cannot be treated as experimentally established returns for every worker. [S21]
For organizations evaluating these models, a small representative pilot should precede broad deployment. Record accepted-output quality, total time including review, corrections required, actual cost, and whether the system stayed within its permissions. This is a proposed evaluation protocol, UNTESTED for any particular organization in this article.
The next year should be judged by completed work
The reviewed releases support a clear interpretation: the scope of professional outputs and tool-supported work expanded during the year. Their differences show why one headline multiplier would hide important variation. [S06, S08, S09, S10]
The forecast scenarios make another point. A continuing rate of improvement can produce large changes without any further acceleration. Doubling or tripling that rate produces much larger outcomes, while increasing the importance of assumptions and measurement limits.
The most useful question for September 2027 is therefore concrete:
What can the system finish correctly, how much intervention does it require, what does the accepted result cost, and can we verify what it did?
That is the standard by which a new class of AI should earn responsibility.