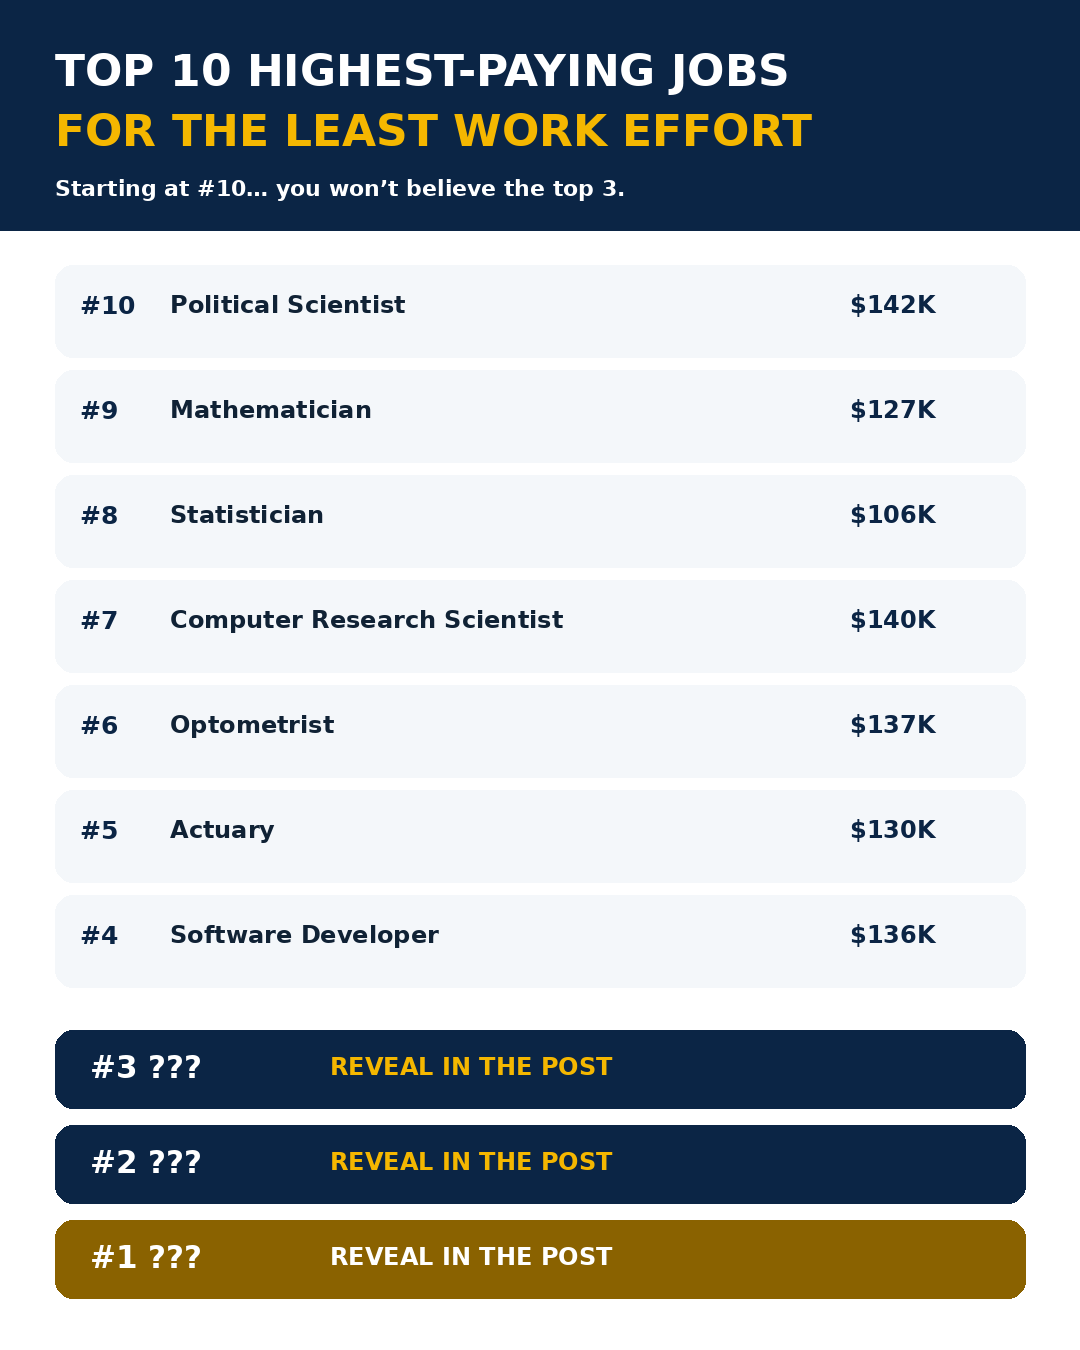
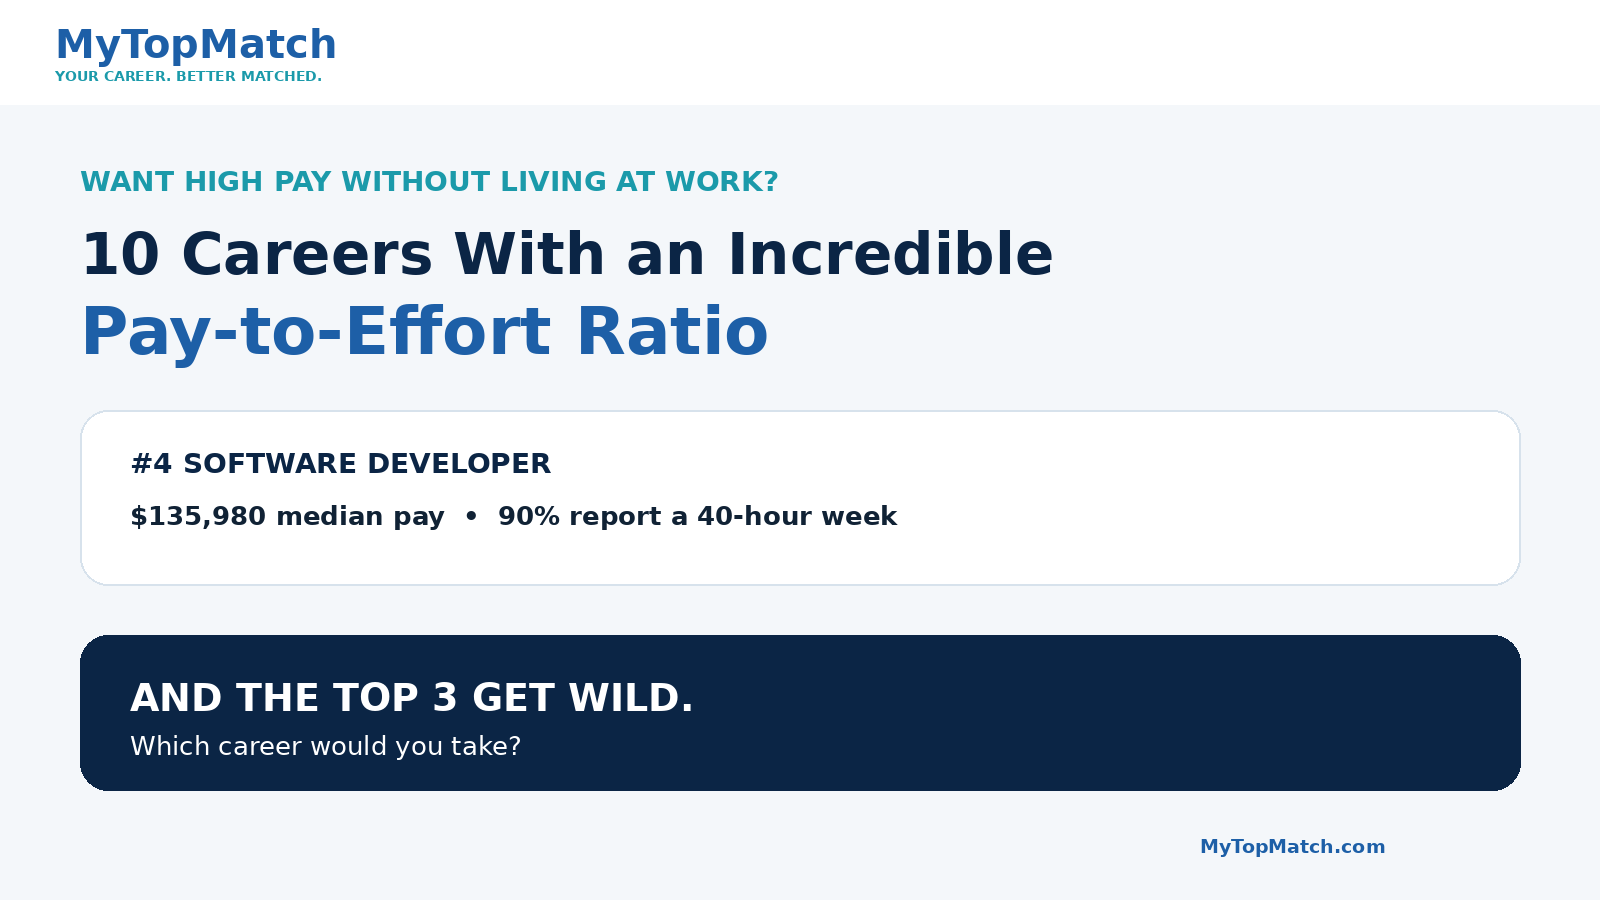
Everybody wants to make more money.
The more interesting question is:
How much of your life should you have to give up to earn it?
Traditional career rankings usually start with salary. That tells us what an occupation pays, but very little about how much time, pressure, physical effort, professional responsibility, or loss of autonomy comes with that paycheck.
MyTopMatch examined a group of high-paying U.S. occupations through a different lens: effort-adjusted pay.
The analysis considered:
- compensation;
- typical weekly hours;
- strict deadline/time pressure;
- physical demands and working conditions;
- professional autonomy and decision-making freedom.
Training and educational preparation were treated as a separate entry cost, rather than part of daily occupational effort.
This is an editorial analysis of federal occupational data. BLS and O*NET do not publish an official “least work” ranking.
What this ranking means
This is a comparison of ten selected high-paying occupations, not an exhaustive ranking of every U.S. career. The order reflects MyTopMatch’s editorial assessment of compensation and work context; no separate numerical effort score or estimated hourly return is reported. Training is an entry cost, not a claim that the work is easy.
Pay figures are national median annual wages for May 2025. Workweek and work-context percentages describe O*NET respondents, not a guarantee about every worker or employer. The wage and work-context datasets are separate; the charts do not estimate an individual worker’s pay per hour.
The ten careers
MyTopMatch’s Effort-Adjusted Pay ranking. Pay is the May 2025 national median annual wage in U.S. dollars; the editorial rank is not salary order.
| # | Career | Median annual pay |
|---|---|---|
| 1 | Dermatologist | $328,730 |
| 2 | Orthodontist | $289,140 |
| 3 | General Dentist | $170,950 |
| 4 | Software Developer | $135,980 |
| 5 | Actuary | $130,000 |
| 6 | Optometrist | $136,570 |
| 7 | Computer & Information Research Scientist | $140,300 |
| 8 | Statistician | $105,650 |
| 9 | Mathematician | $126,710 |
| 10 | Political Scientist | $142,080 |
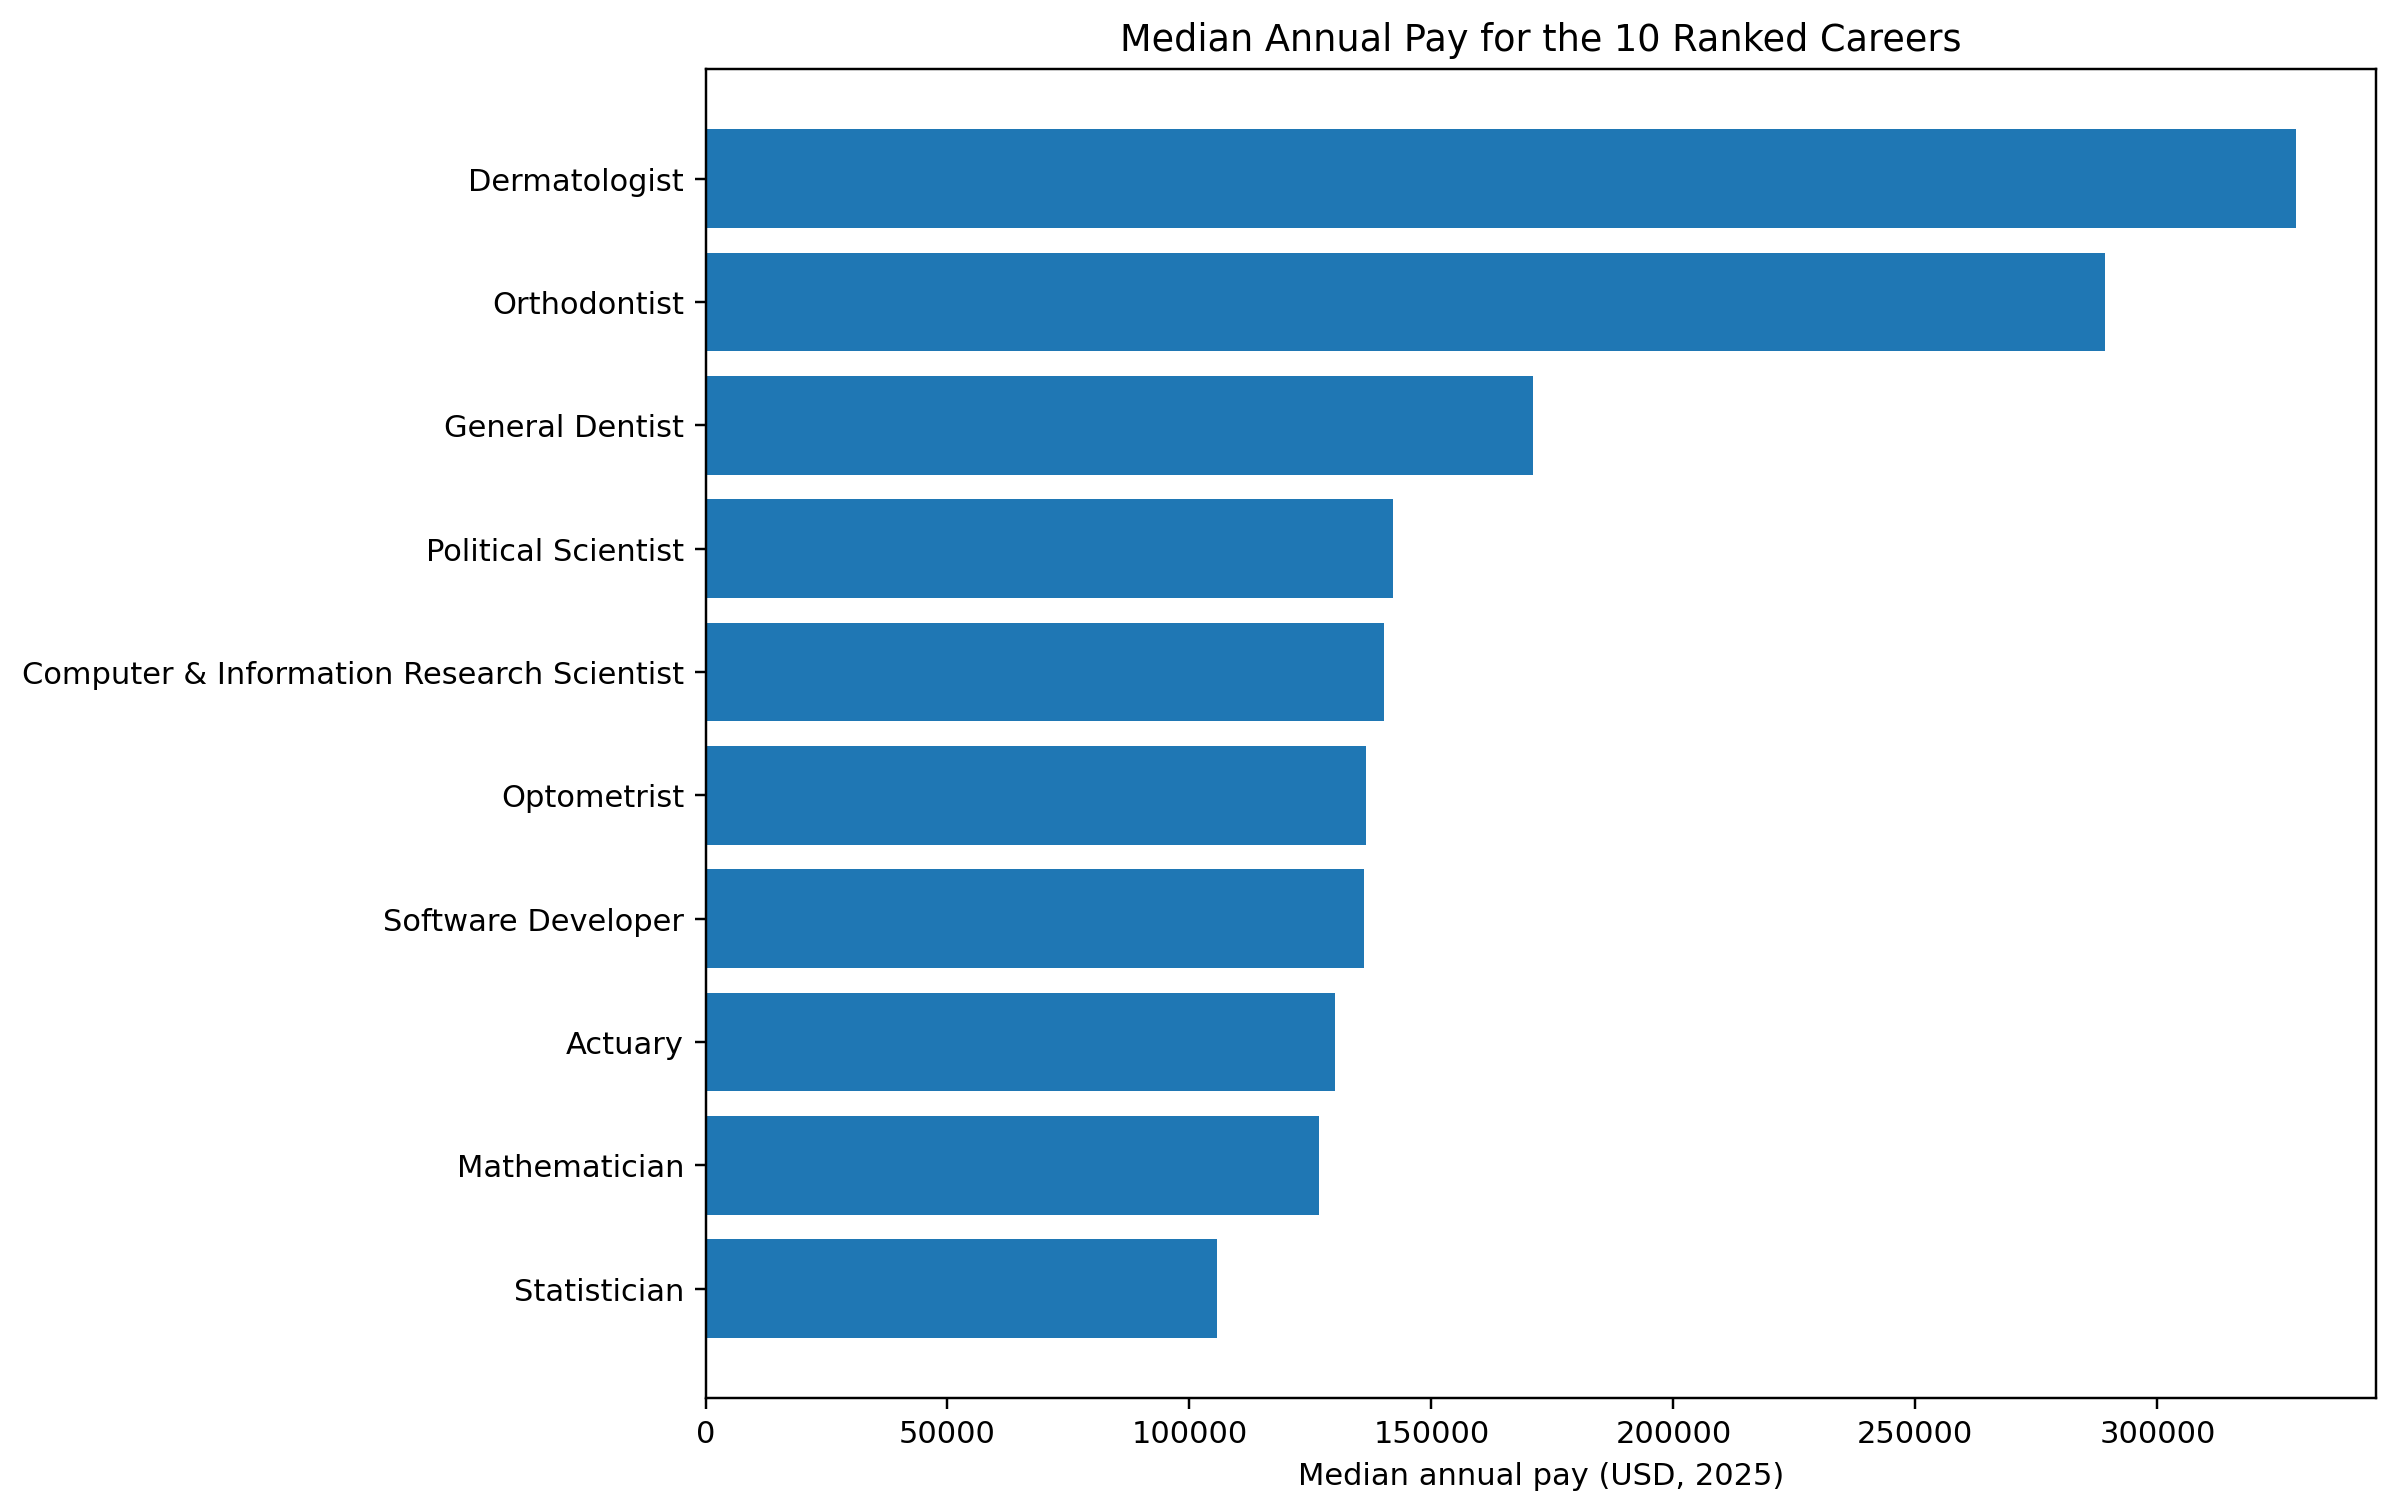
The countdown: from number ten to number one
#10 Political Scientist — $142,080
- High decision freedom: 85% report a lot of freedom to make decisions.
- 81% report substantial freedom in determining tasks, priorities, and goals.
- 77% report working more than 40 hours.
- Time pressure is more commonly weekly/monthly than daily.
#9 Mathematician — $126,710
- 65% report a lot of decision freedom.
- 55% report a lot of freedom over tasks/priorities/goals.
- 60% report working more than 40 hours.
- Time pressure most commonly monthly.
- Significant preparation barrier.
#8 Statistician — $105,650
- 52% report exactly 40 hours.
- 48% report more than 40.
- 71% sit continually/almost continually.
- Time pressure is mostly weekly/monthly.
#7 Computer & Information Research Scientist — $140,300
- BLS projects strong growth.
- 58% report exactly 40 hours.
- 42% report more than 40.
- 54% report a lot of decision freedom.
- 94% work indoors in controlled environments.
- Strong intellectual rather than physical workload.
#6 Optometrist — $136,570
- BLS notes that part-time work is common.
- Substantial autonomy.
- Clinical patient responsibility and daily time pressure remain material caveats.
#5 Actuary — $130,000
- 56% report exactly 40 hours.
- 44% report more than 40.
- Time pressure is more often monthly than daily.
- 79% sit continually/almost continually.
- Examination/credential burden is a major entry cost.
#4 Software Developer — $135,980
- 90% report exactly 40 hours.
- 95% sit continually/almost continually.
- Strict time pressure: 13% daily, 40% weekly, 34% monthly.
- 41% report a lot of decision freedom; another 46% report some.
- Strongest practical/non-medical “wildcard” because it combines six-figure compensation, a conventional workweek, low physical demands, and no medical/dental training pipeline.
#3 General Dentist — $170,950
- 62% report less than 40 hours.
- 38% report exactly 40 hours.
- 100% report a lot of decision freedom.
- 80% report a lot of freedom over tasks/priorities/goals.
- Major caveats: extreme accuracy, health/safety responsibility, hand-intensive work, disease exposure, repetitive motions, and serious consequences of error.
#2 Orthodontist — $289,140
- 19% report less than 40 hours.
- 56% report exactly 40 hours.
- 75% therefore report 40 hours or less.
- 83% report a lot of decision freedom.
- 70% report a lot of freedom over tasks/priorities.
- High clinical responsibility remains important.
#1 Dermatologist — $328,730
- 33% report less than 40 hours.
- 27% report exactly 40 hours.
- 60% therefore report 40 hours or less.
- 99% report a lot of decision freedom.
- Severe training barrier and serious medical responsibility remain important.
- Among the screened elite-paying careers, dermatology produced the strongest combination of compensation, schedule, and autonomy.
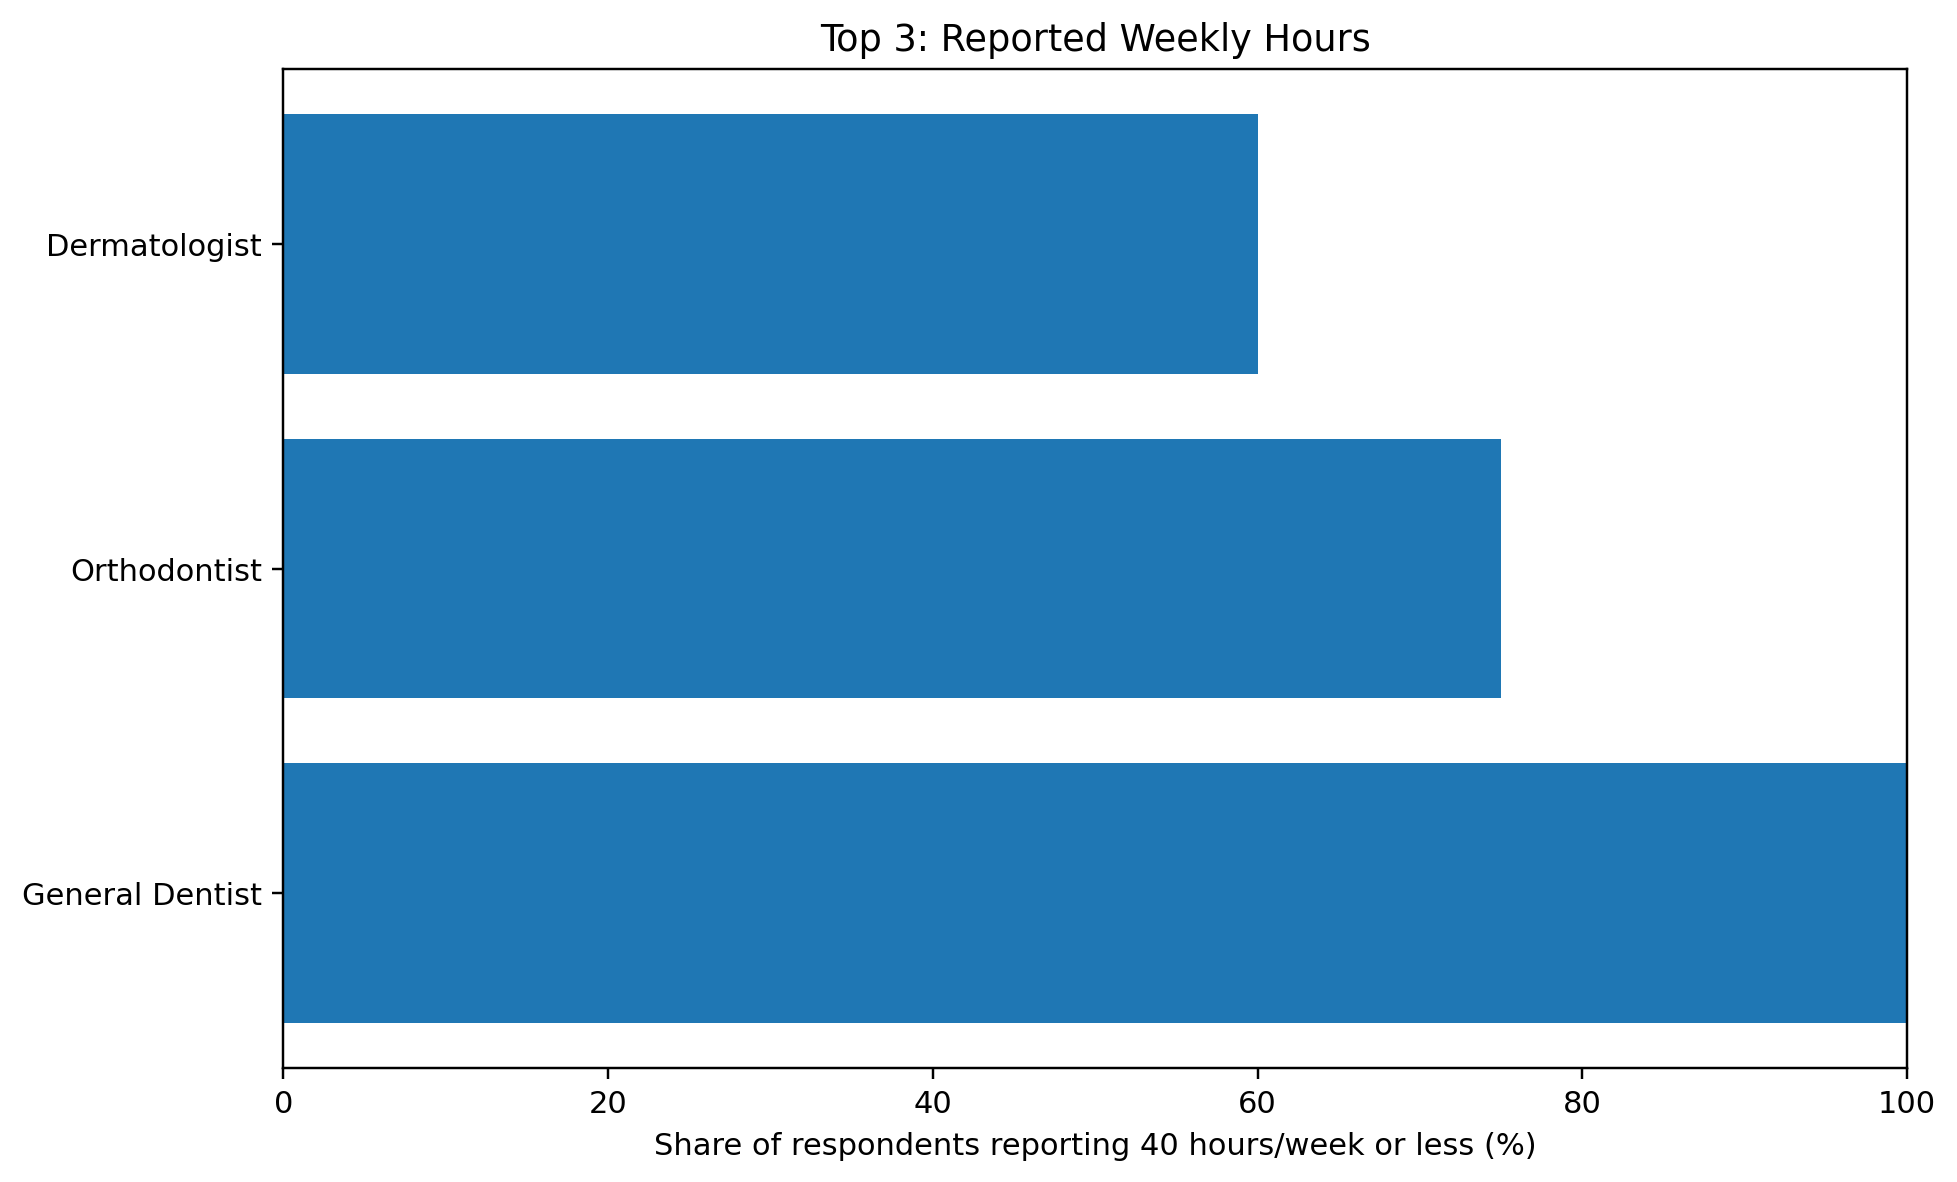
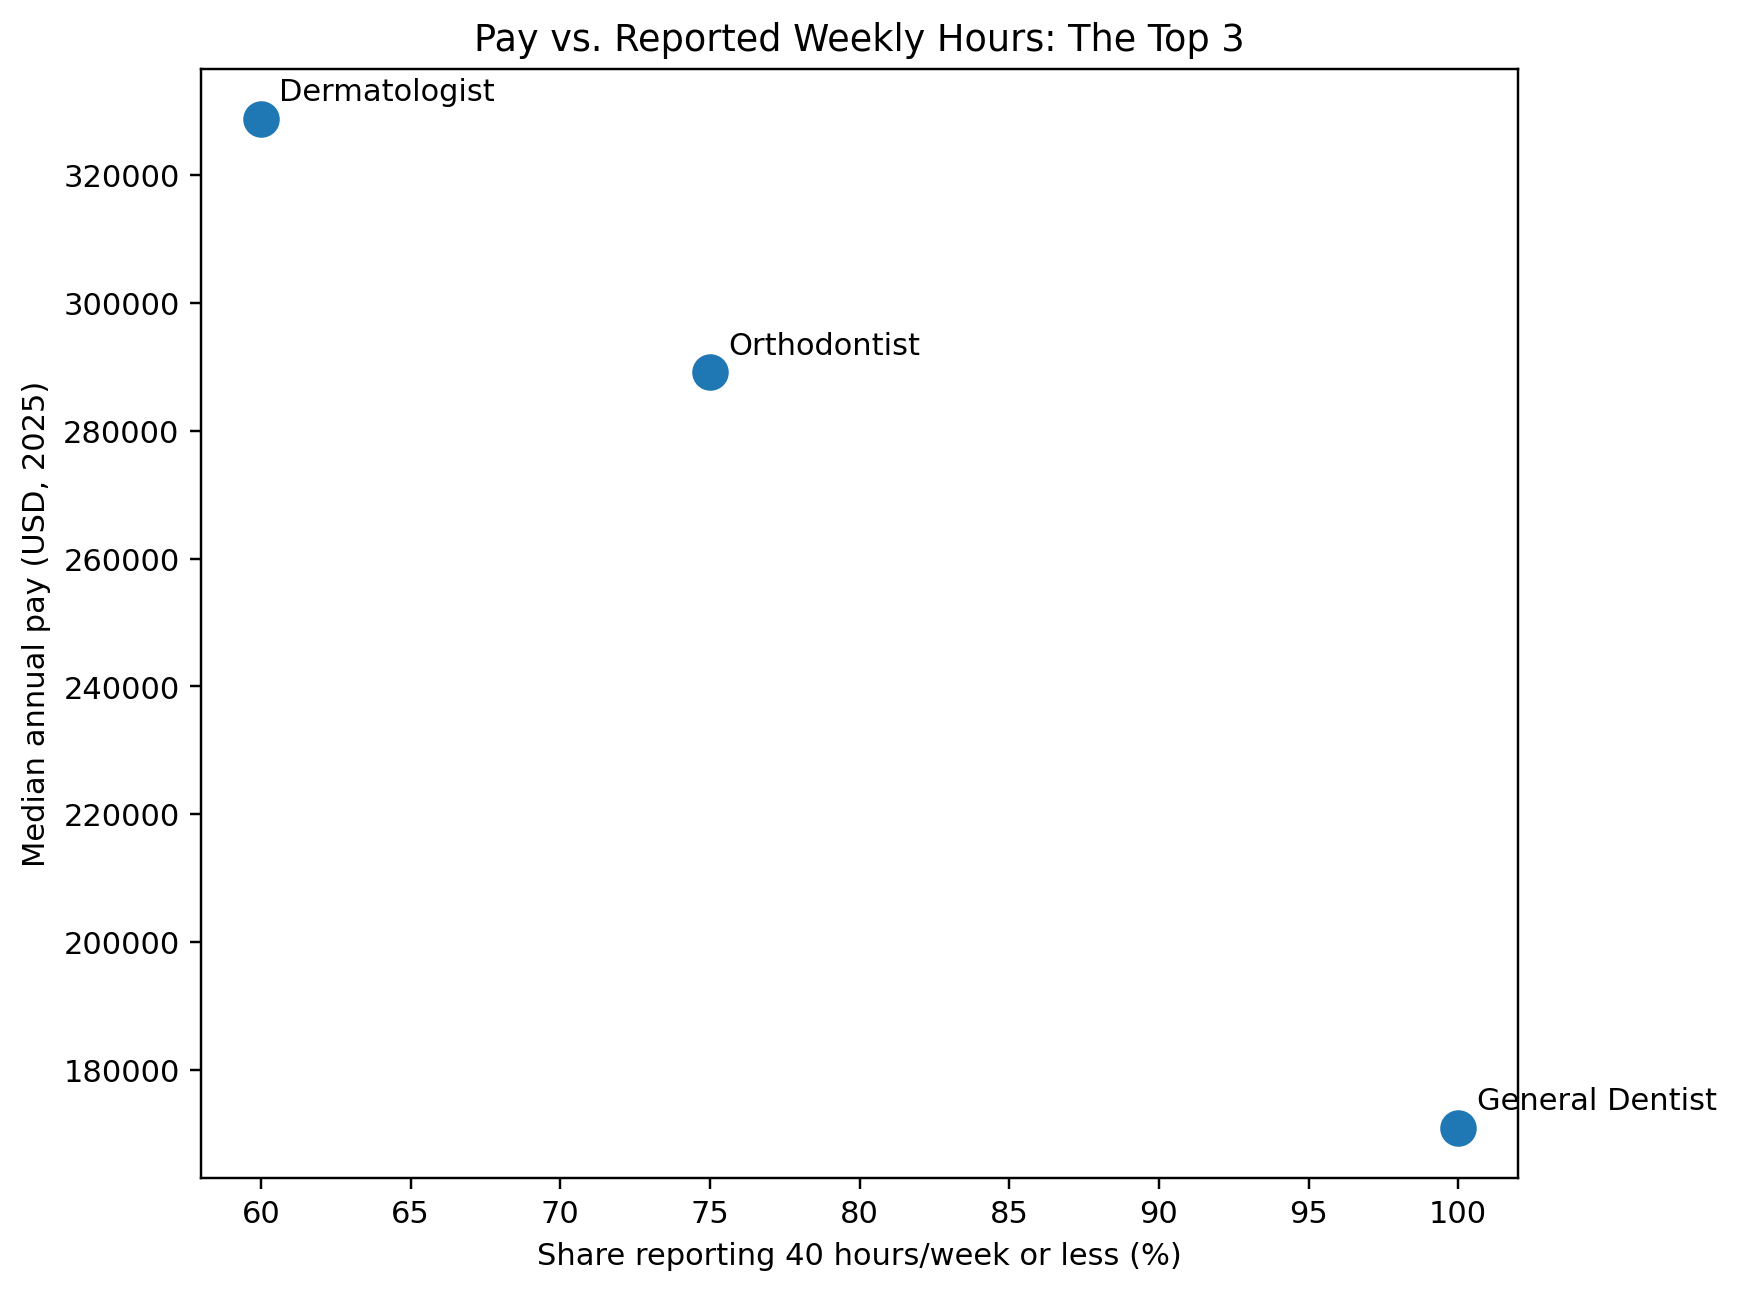
The top three: pay and reported workweek
O*NET workweek responses for the top three careers. “40 hours or less” sums the two displayed categories; it does not measure stress or clinical responsibility.
| Career | Under 40 hours | 40 hours | 40 hours or less |
|---|---|---|---|
| Dermatologist | 33% | 27% | 60% |
| Orthodontist | 19% | 56% | 75% |
| General Dentist | 62% | 38% | 100% |
The practical wildcard: software developer
Software Developer may be the most attainable high-pay/low-workload option for a broad audience because the occupation combines approximately $135,980 median pay with a conventional 40-hour schedule for most O*NET respondents and little physical demand.
That is MyTopMatch’s interpretation of the selected careers, not a promise of easy entry or low stress. Employer, team, seniority, on-call expectations and personal fit still matter.
What to take into a career decision
Salary alone is an incomplete measure of career success. A more useful career decision examines income, time, autonomy, stress, meaning, required preparation, physical demands, energy left after work and personal fit.
The clinical careers at the top combine strong pay and autonomy with serious responsibility and demanding preparation. Shorter reported hours should never be read as an absence of skill, pressure or consequences of error.
Methodology and limitations
- Compensation: May 2025 national median annual wages from BLS, checked against the wage panels in all ten O*NET profiles.
- Daily work context: O*NET responses about weekly hours, strict deadlines, physical demands and freedom to make decisions and structure work.
- Education, examinations and professional training remain a separate entry cost. The ranking does not deduct training debt or years of foregone earnings.
- The ranking is an original editorial interpretation of selected occupations. BLS and O*NET do not publish an official “least work” ranking.
- No numerical scoring formula is reported for this ranking. Its order is an editorial judgment, not a validated occupational index or a calculation of pay per hour.
- Job satisfaction and burnout are outside this first ranking. They belong to the separate follow-up research package and have not been mixed into these results.