

The finding
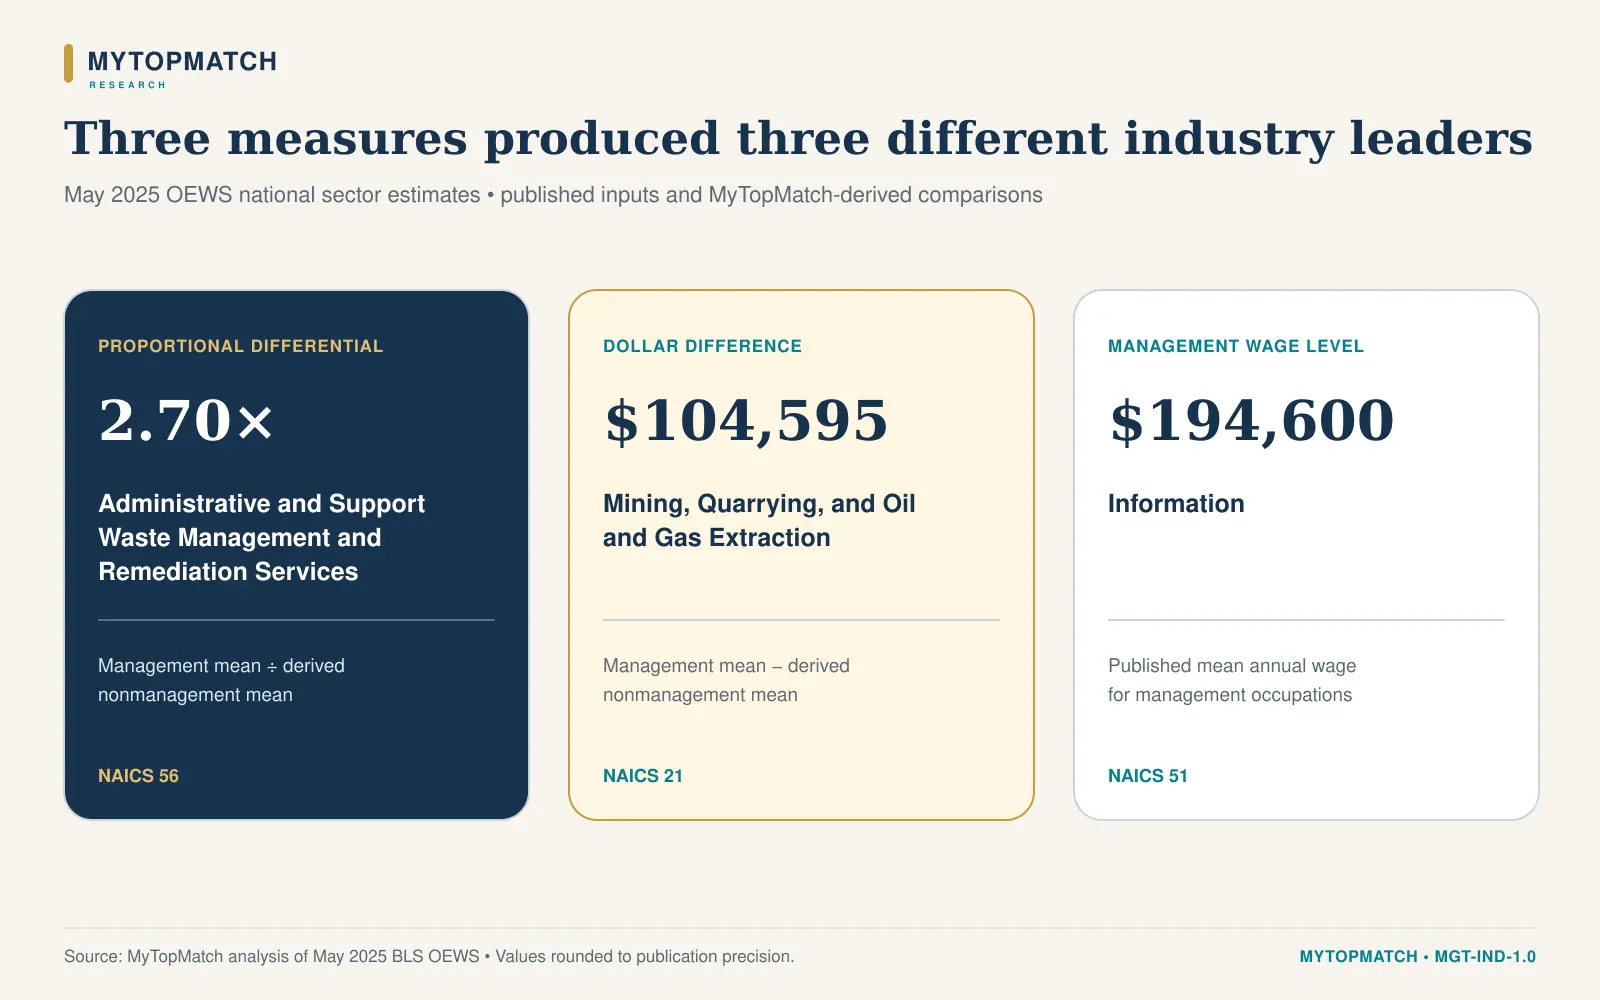
Management pay has more than one industry leader.
A MyTopMatch analysis of the Bureau of Labor Statistics' May 2025 Occupational Employment and Wage Statistics found three distinct results:
- Largest proportional differential: Management occupations in Administrative and Support and Waste Management and Remediation Services averaged 2.70 times the estimated mean wage of nonmanagement employees in the same sector.
- Largest dollar differential: Mining, Quarrying, and Oil and Gas Extraction produced the largest estimated annual gap, at approximately $104,595.
- Highest management wage: Management occupations in Information had the highest published mean annual wage, at $194,600.
Those leaders answer different questions. A ratio describes relative distance from a sector's nonmanagement wage base. A dollar gap describes the estimated annual difference. A management wage level describes how much the management group earned without reference to the comparison workforce.
The widest proportional difference appeared in administrative and support services
The published sector estimate covered approximately 9.1 million wage-and-salary jobs in Administrative and Support and Waste Management and Remediation Services. About 488,670 of those jobs were in the management occupational group.
BLS reported a mean annual wage of 139,220 for management occupations and 56,320 for all occupations in the sector. MyTopMatch removed management employment and its estimated wage total from the sector total, producing an estimated nonmanagement mean of $51,623.
The resulting calculation was:
Management wage ratio = $139,220 ÷ $51,623 = 2.70.
The corresponding estimated dollar differential was $87,597.
This sector remained the proportional leader among full-coverage sectors under two alternate definitions: the published management mean divided by the published all-occupation mean, and the published management median divided by the published all-occupation median.
The five largest proportional differentials among full-coverage sectors
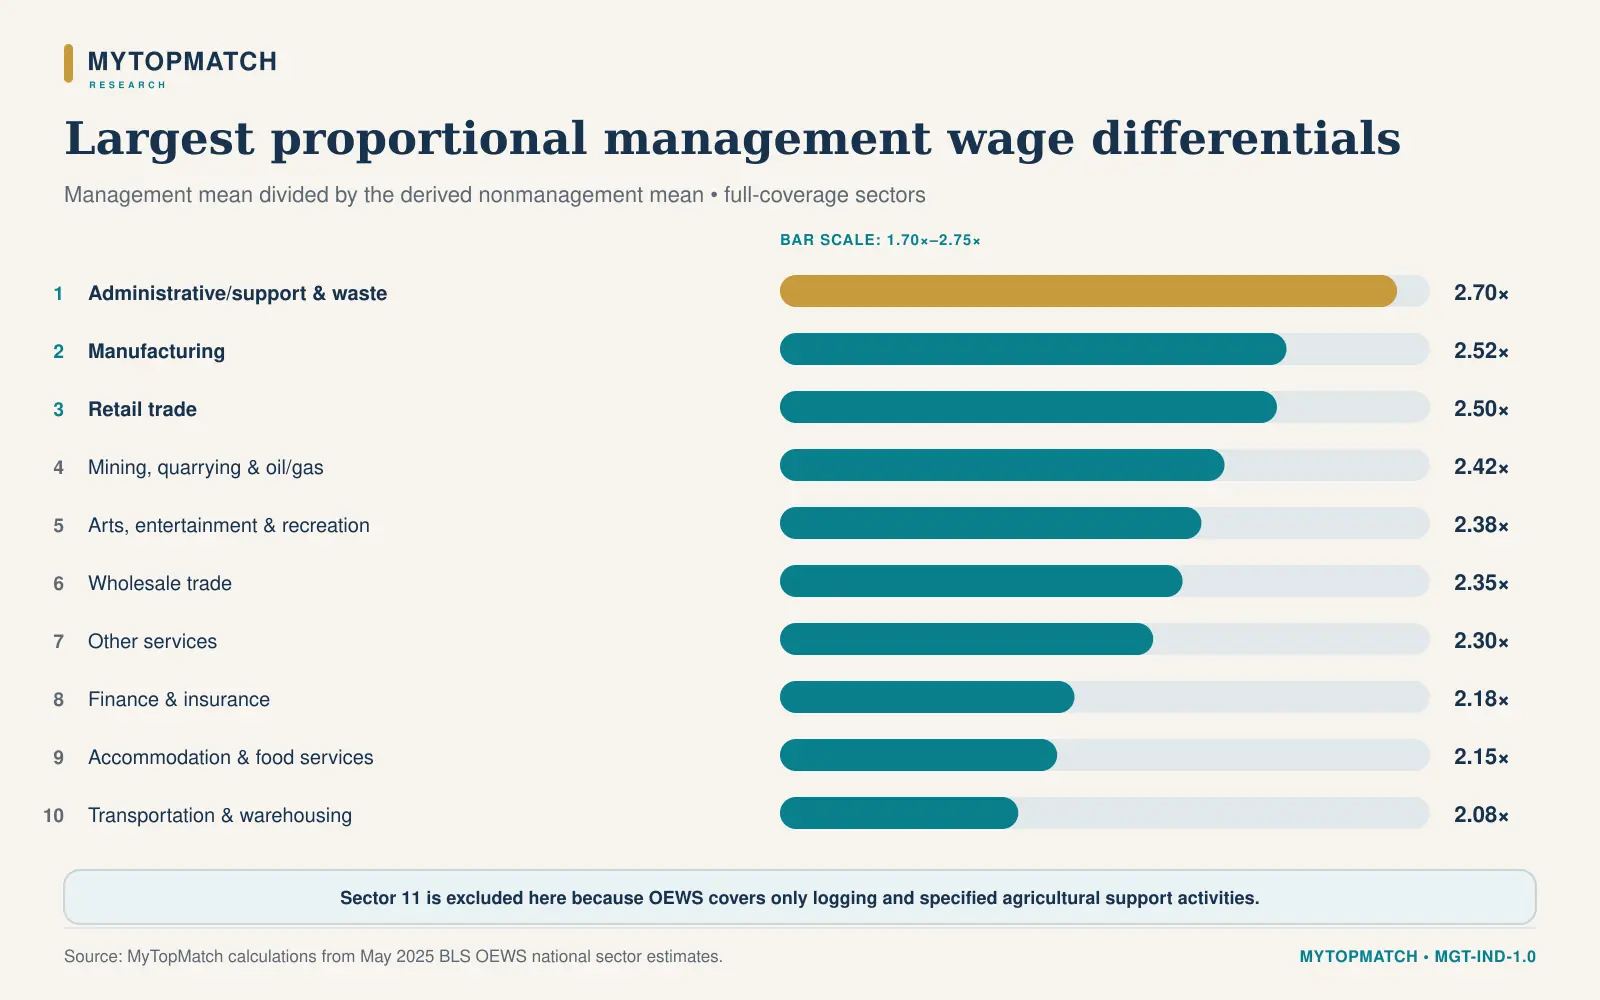
| Rank | Major sector | Management mean | Derived nonmanagement mean | Ratio | Dollar difference |
|---|---|---|---|---|---|
| 1 | Administrative and Support and Waste Management and Remediation Services | $139,220 | $51,623 | 2.70 | $87,597 |
| 2 | Manufacturing | $157,490 | $62,540 | 2.52 | $94,950 |
| 3 | Retail Trade | $105,450 | $42,133 | 2.50 | $63,317 |
| 4 | Mining, Quarrying, and Oil and Gas Extraction | $178,350 | $73,755 | 2.42 | $104,595 |
| 5 | Arts, Entertainment, and Recreation | $114,160 | $47,952 | 2.38 | $66,208 |
Source: MyTopMatch calculations from May 2025 BLS OEWS national sector estimates. Dollar values derived from published estimates may differ by a few dollars because BLS publishes rounded employment and wage values.
The published Sector 11 category showed a ratio of 2.61, which would place second in the unqualified numerical ordering. BLS does not cover most agricultural employment in OEWS; the sector estimate covers logging and specified agricultural support activities. MyTopMatch therefore reports the result in the supporting workbook but excludes it from the main full-coverage ranking.
Proportional difference and dollar difference are separate economic stories
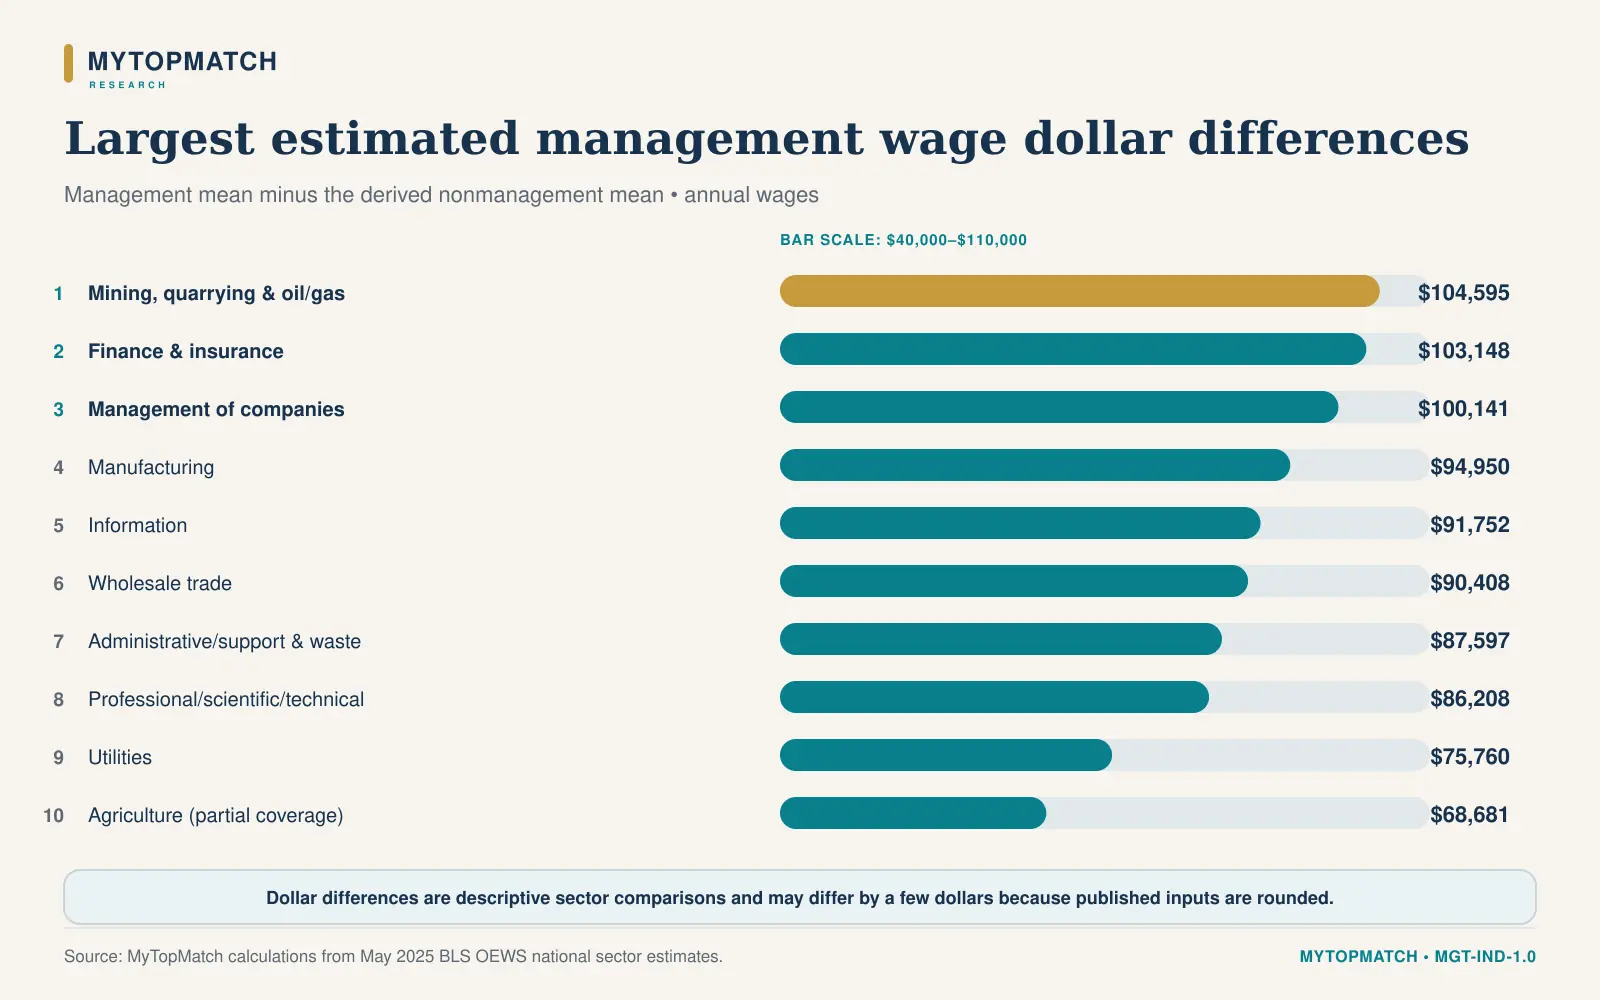
Mining led the dollar comparison even though it ranked fourth among full-coverage sectors by proportional differential. Its management mean was 178,350, compared with an estimated nonmanagement mean of 73,755, producing a gap of approximately $104,595.
Finance and Insurance followed with an estimated gap of 103,148. Management of Companies and Enterprises followed at 100,141.
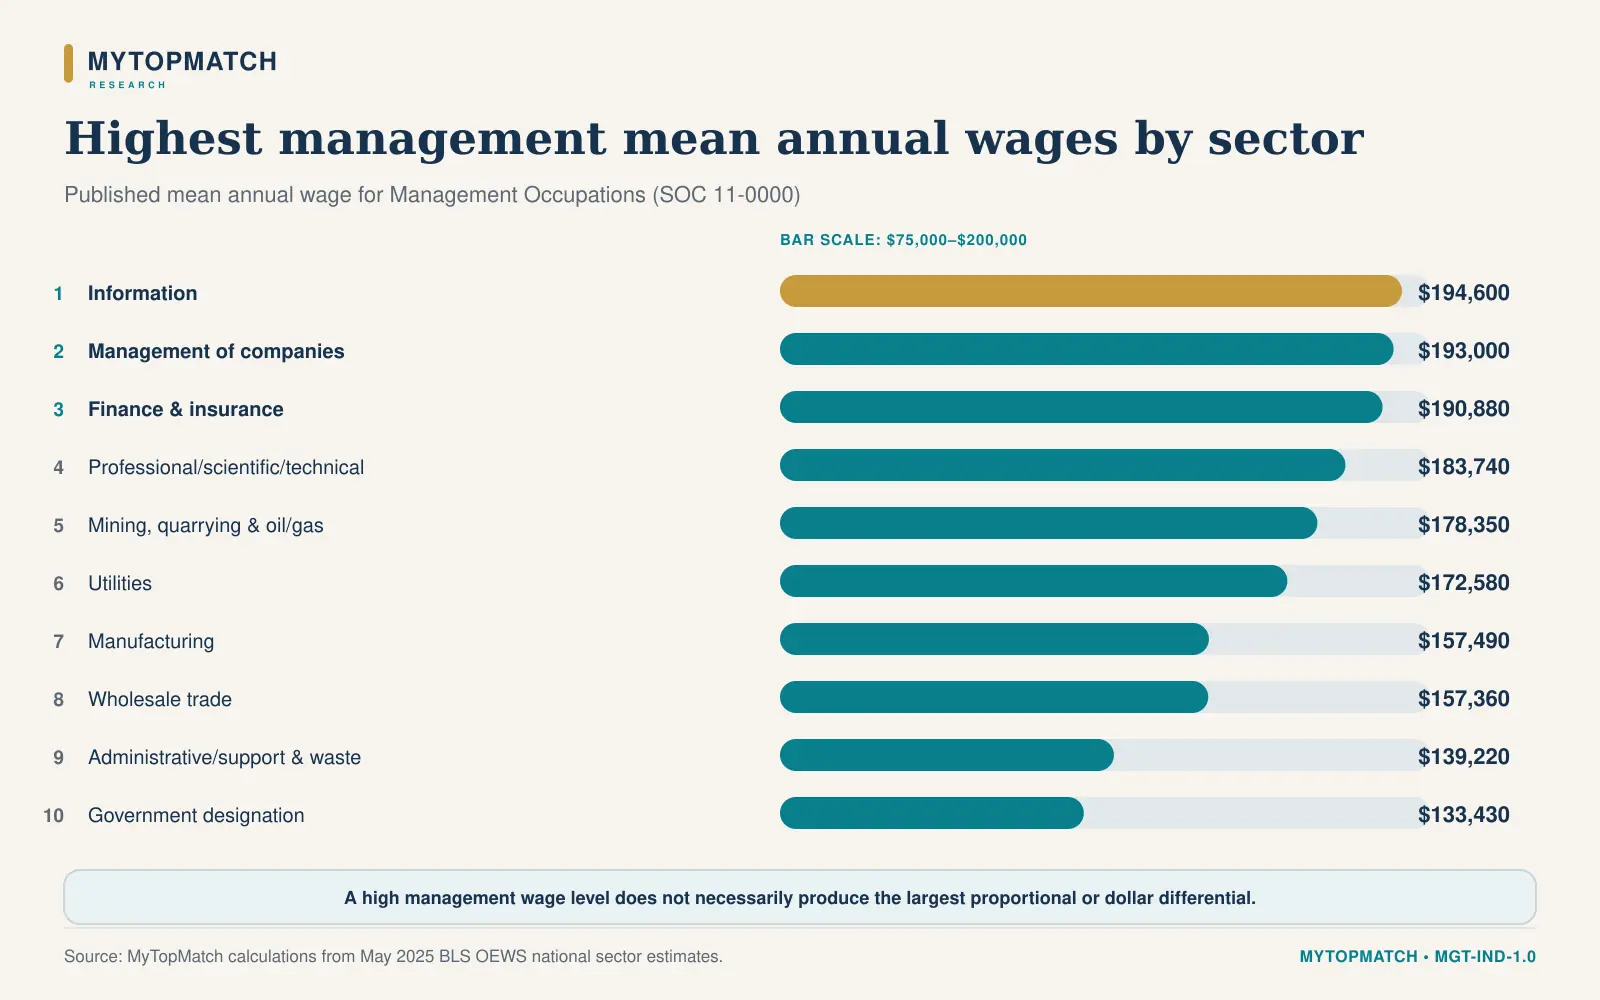
The ordering changed again when the question became simply, “Where were management wages highest?” Information led at 194,600, followed by Management of Companies and Enterprises at 193,000 and Finance and Insurance at $190,880.
The rank correlation between the proportional differential and the dollar differential was 0.43 across 20 sector categories. That result was descriptive; with only 20 categories and a two-sided p-value of approximately 0.059, it did not clear a conventional 0.05 significance threshold. MyTopMatch does not treat it as evidence of a stable population relationship.
Every published sector category showed a management wage difference
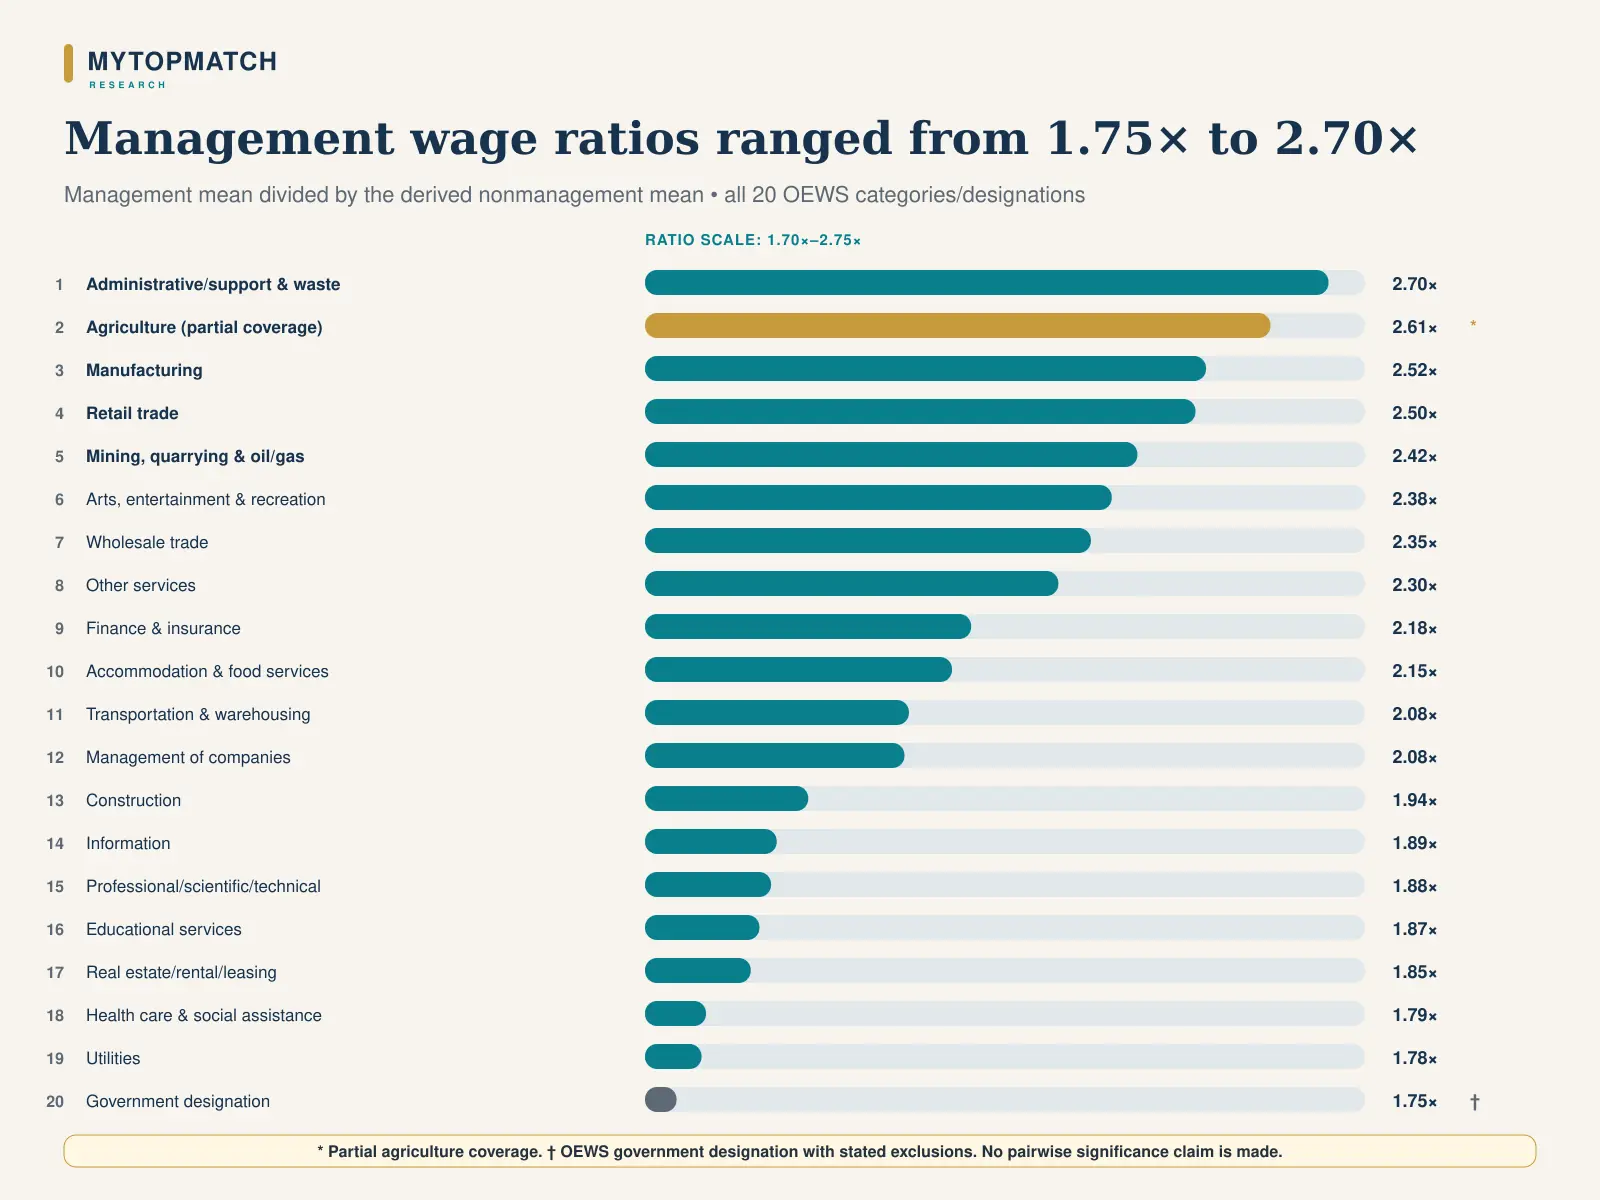
Across the 20 national OEWS sector categories and government designation analyzed, the management-to-nonmanagement mean-wage ratio ranged from 1.75 to 2.70. The median sector ratio was 2.12.
The lowest ratio appeared in the OEWS government designation, at 1.75. Utilities followed at 1.78, and Health Care and Social Assistance at 1.79. These are still substantial descriptive differences, but they should not be interpreted as the amount an individual would gain by receiving a promotion.
Why this is a wage differential rather than a promotion premium
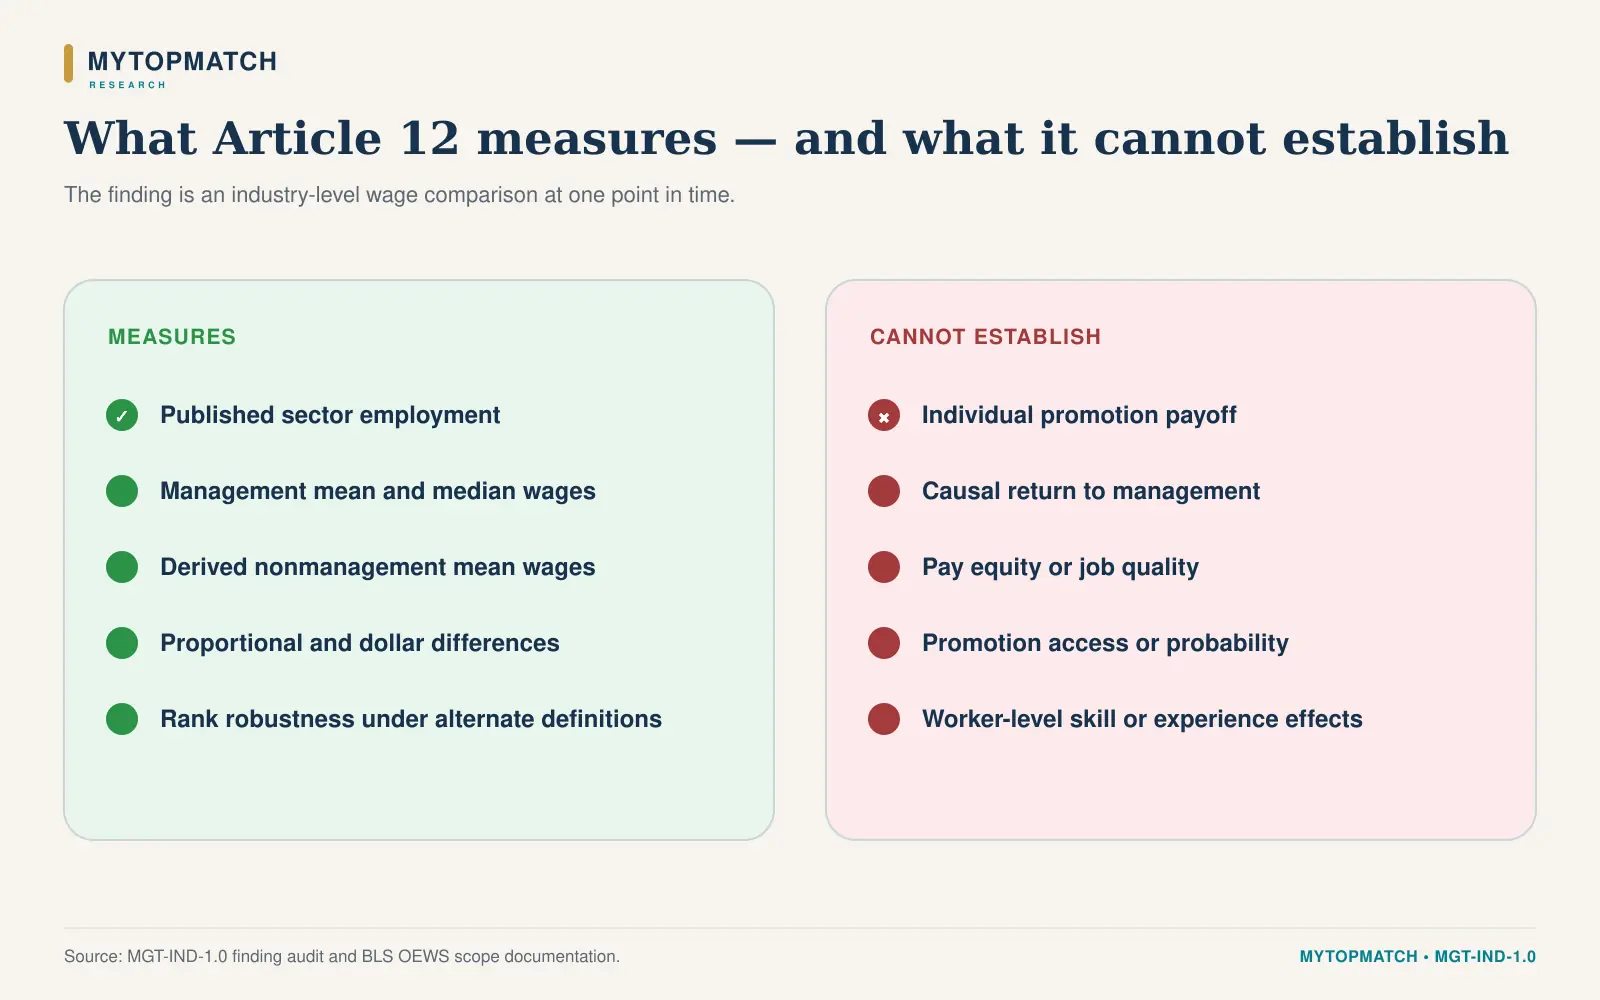
This analysis compares different occupational groups at one point in time. It does not follow the same workers before and after a promotion. It does not adjust for education, experience, tenure, hours, establishment size, geography, occupation mix, responsibility, authority, or selection into management.
The calculated ratio can reflect several forces at once:
- the mix of specific management occupations within an industry;
- the mix and wage level of the industry's nonmanagement workforce;
- differences in education, experience, hours, or job requirements;
- the concentration of high-paying firms or activities;
- compensation features captured or excluded by OEWS wage definitions.
For those reasons, the public finding is an industry-level wage differential. It is not a causal estimate of the return to becoming a manager.
What the analysis means for workers
Workers evaluating management opportunities should ask three separate questions:
- What is the actual wage for this management occupation? A large ratio can coexist with a lower absolute salary.
- How does the offer compare with similar nonmanagement work in the same industry and location? National sector averages are reference points, not offer-specific valuations.
- What responsibilities and working conditions accompany the role? OEWS wages do not measure authority, workload, schedule control, benefits, job quality, or promotion probability.
An industry may look attractive on one measure and ordinary on another. The best comparison depends on the decision being made.
What employers and leadership teams can use
For employers, the results provide an external descriptive benchmark for reviewing career architecture and compensation structures. They can help identify questions for a company-level analysis:
- How far are management pay bands from individual-contributor bands?
- Does the difference increase consistently with responsibility?
- Are internal promotion increases aligned with the role change?
- Do pay relationships differ by function, geography, or workforce composition?
Company decisions require internal data. The sector results cannot establish pay equity, appropriate compensation, or the causal value of management responsibility inside a particular organization.
Methodology
Source data
The analysis uses the May 2025 national sector file from the BLS Occupational Employment and Wage Statistics program. BLS published the release on May 15, 2026. The file uses the 2018 Standard Occupational Classification system and 2022 North American Industry Classification System sectors.
OEWS is an establishment survey of wage-and-salary employment in nonfarm establishments. The May 2025 estimates combine six semiannual panels collected from November 2022 through May 2025. BLS reports that the full sample included approximately 1.1 million establishments. OEWS excludes self-employed workers and most agricultural employment.
Analytical universe
MyTopMatch selected the published all-occupation row (00-0000) and management major-group row (11-0000) for each of 20 national sector categories/designations. No sector was removed from the workbook. Sector 11 is flagged because OEWS coverage is limited to logging and specified agricultural support activities. The government designation is flagged because it is an OEWS-defined public-sector grouping with stated exclusions.
Primary calculation
For each sector:
Nonmanagement mean wage = [(all-sector employment × all-sector mean wage) − (management employment × management mean wage)] ÷ (all-sector employment − management employment).
Management wage ratio = management mean wage ÷ derived nonmanagement mean wage.
This removes management occupations from the comparison denominator. Because the published estimates are rounded, the derived nonmanagement mean and dollar difference are reported to the nearest dollar.
Robustness checks
The study compared the primary ordering with:
- management mean divided by the published all-occupation mean;
- management median divided by the published all-occupation median;
- the primary calculation excluding partial-coverage Sector 11; and
- the primary calculation excluding the government designation.
The primary ratio ranking and published-median ratio ranking had a Spearman correlation of 0.87 across the 20 categories. Administrative and Support and Waste Management and Remediation Services remained the proportional leader among full-coverage sectors under all three wage-ratio definitions.
Estimate precision
BLS publishes percent relative standard errors for employment and mean-wage estimates. Across the 20 management rows, employment PRSE values ranged no higher than 3.2%, and mean-wage PRSE values no higher than 1.8%. These values support the use of the published sector estimates for descriptive comparison, but they do not quantify the uncertainty of the derived ratio because the covariance between inputs is unavailable in the public file.
No confidence interval is presented for the derived ratio. No claim of statistical difference between individual sectors is made.
Important limitations
- OEWS excludes self-employed workers and most agricultural employment.
- Industry estimates describe establishments; occupation codes describe the work performed.
- Annual wage estimates generally convert hourly wages using 2,080 hours, with special handling for occupations commonly paid annually.
- Wages exclude overtime pay, severance pay, shift differentials, nonproduction bonuses, employer benefit costs, and tuition reimbursement.
- The management group combines multiple management occupations with different responsibilities and pay levels.
- Industry rankings are sensitive to the selected denominator and to occupational composition.
- The published data are rounded, so derived values carry small rounding error.
- The analysis is cross-sectional and does not establish causation, promotion outcomes, mobility, access, job quality, or individual fit.
- OEWS's three-year pooled design and classification changes limit time-series interpretation; this article makes no trend claim.
Data sources
- BLS OEWS May 2025 tables and downloads
- May 2025 national industry-specific OEWS estimates
- May 2025 OEWS technical notes
- OEWS frequently asked questions
- BLS copyright and public-domain information
The source-data archive used for the calculation was oesm25in4.zip, SHA-256 3ef0e42fab1b42a7dac8a3a9b3e7024f5d7a07eff308bff5fc91808061ec08e1.
Citation and reuse
Suggested citation: MyTopMatch Research. (2026). “Management Pay Differentials Ran From 1.75x to 2.70x Across Major U.S. Sectors.” MyTopMatch. https://mytopmatch.com/publications/management-wage-differential-by-industry
When reusing findings, identify the work as original analysis by MyTopMatch Research, identify the underlying public data publisher where relevant, and link to this canonical article. Source publishers do not endorse MyTopMatch's calculations or interpretations.