

A strong score can still fail a responsible release standard
Career-change models are easy to overstate. A system can rank many observed destinations near the top and still be too dependent on occupational size, weakly calibrated, unstable across surveys, or misleading for individual decisions.
MyTopMatch designed Article 10 around that risk. Before inspecting the held-out test results, the research protocol froze the cohorts, model features, evaluation metrics, and release thresholds. The question was not simply whether the model performed better than chance. The question was whether it passed every condition required before MyTopMatch would publish transition rankings.
It did not.
The model’s weighted macro AUC was 0.925, with an independent 95% person-cluster bootstrap interval of 0.916 to 0.933. Its top-ten recall was 48.9%, with an interval of 45.4% to 52.6%. These are strong discrimination and retrieval results in a 349-candidate destination task.
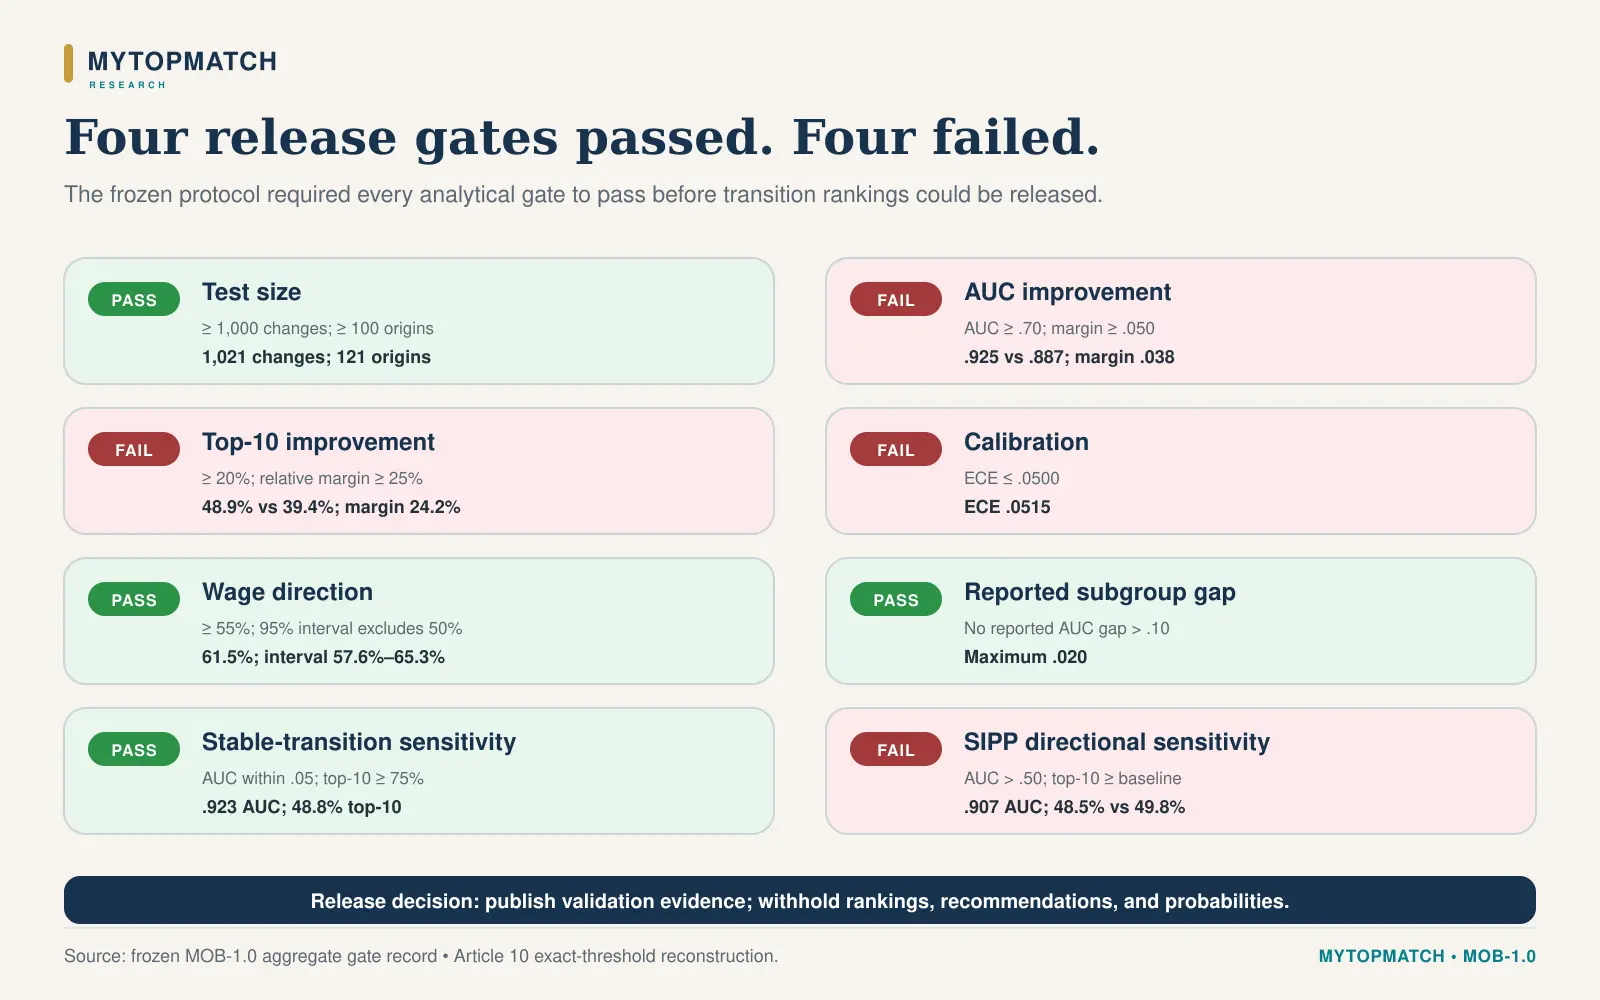
The release rule required more. Four analytical gates passed and four failed. MyTopMatch is preserving the preregistered decision rather than changing a threshold after seeing the result.
What was tested
For each observed occupation change, the model ranked every eligible detailed occupation other than the worker’s source occupation. The frozen universe contained 350 occupations, which created 349 possible destinations per event.
The model combined twelve transparent features:
- skills cosine similarity;
- knowledge cosine similarity;
- abilities cosine similarity;
- work-activities cosine similarity;
- positive education gap;
- positive experience gap;
- positive on-the-job-training gap;
- positive Job Zone gap;
- target opportunity score;
- log target employment;
- same major occupational family; and
- log occupational median-wage difference.
The statistical form was a regularized pairwise logistic utility model. Training used 20 sampled negative destinations for each observed transition; final evaluation used the full set of 349 candidates. Feature scaling was learned from the training cohort only. Regularization and one score-to-probability temperature were selected using the validation cohort. The held-out test cohort was used once for final metrics and the gate decision.
The frozen cohort design
Monthly CPS records were linked conservatively through public-use household and person identifiers, month-in-sample progression, and consistency checks for sex, race, and age progression. The primary population was civilian employed wage-and-salary workers ages 18–64 with usable occupation mappings and occupations inside the frozen coverage universe.
The cohorts were separated by person. A person assigned to an earlier cohort could not enter a later cohort.
| Cohort | Origin period | Transitions | Unique people | Origins | Role |
|---|---|---|---|---|---|
| Training | Jan. 2024–Jun. 2025 | 3,728 | 3,200 | 148 | Estimate coefficients |
| Validation | Jul.–Dec. 2025 | 744 | 707 | 104 | Select regularization and temperature |
| Held-out test | Jan.–Jun. 2026 | 1,021 | 909 | 121 | Final metrics and release decision |
The Census Bureau did not collect an October 2025 CPS during the federal funding lapse, so no October microdata file exists. The missing September-to-October and October-to-November links were not imputed. July 2026 was used only to observe destinations for June 2026 origin records. The Census Bureau’s CPS methodology describes the survey’s 4-8-4 rotation pattern, which creates the month-to-month overlap that makes conservative linkage possible (CPS methodology; CPS linking guidance; CPS data and footnotes).
The headline results
| Metric | Held-out model | Interpretation |
|---|---|---|
| Weighted macro ROC AUC | 0.925 | The model generally ranked observed destinations above nonchosen candidates within origins. |
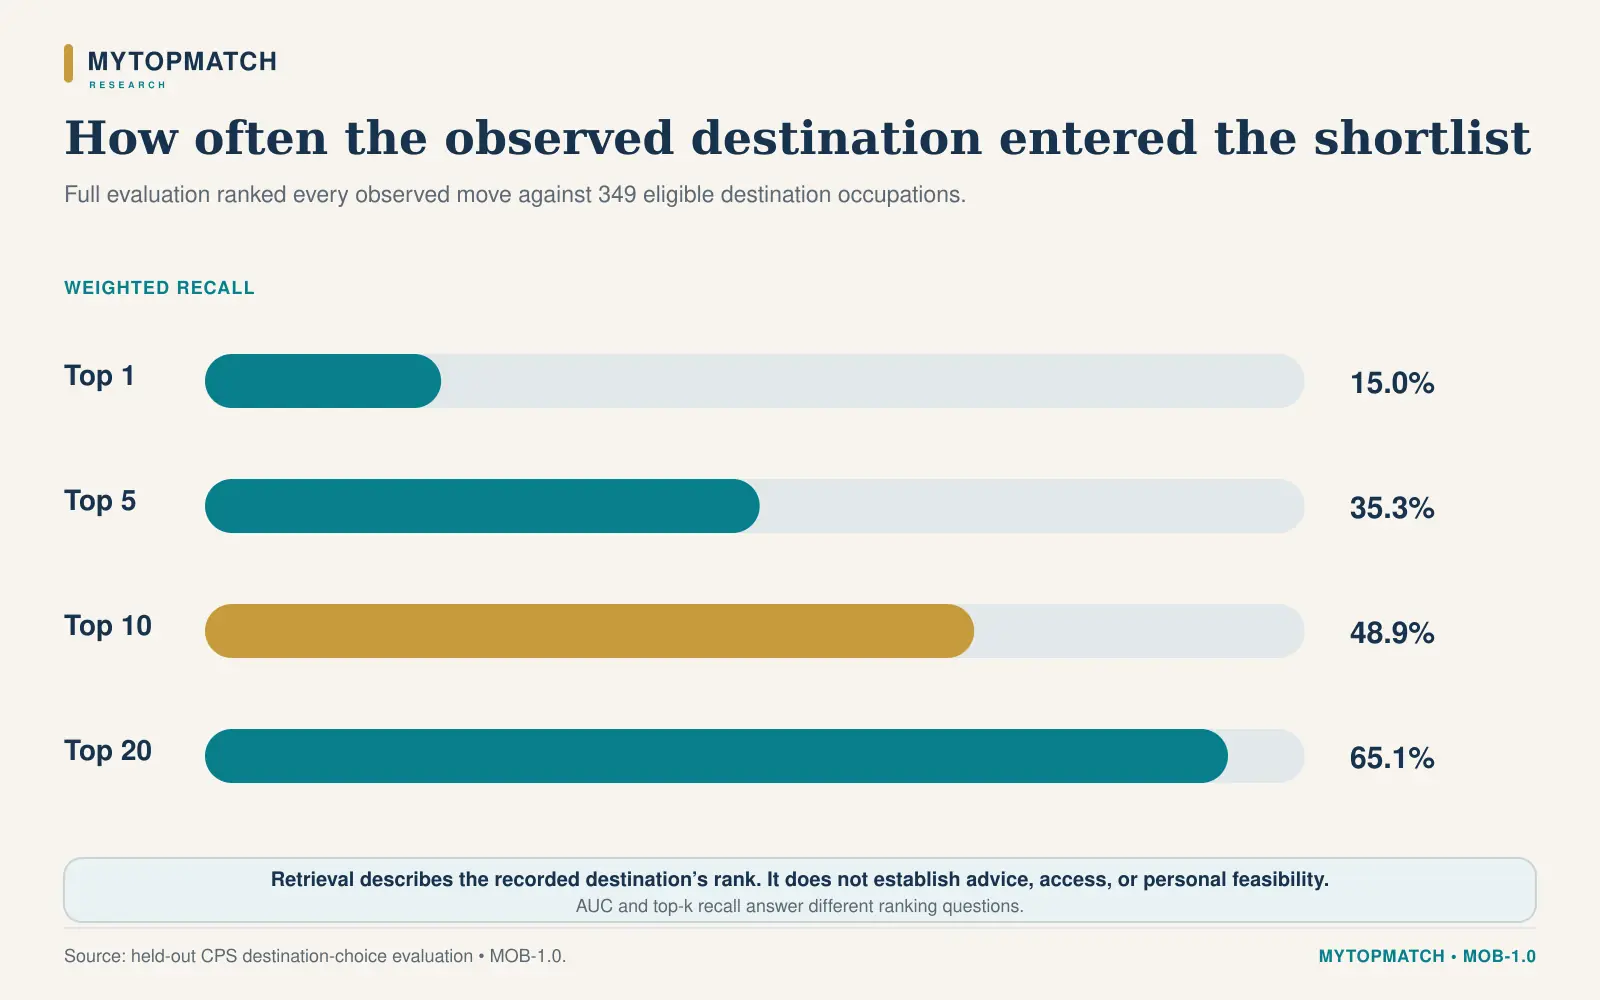
| Top-1 recall | 15.0% | The observed destination was ranked first in 15.0% of weighted transitions. |
| Top-5 recall | 35.3% | The observed destination appeared in the five highest-ranked candidates in 35.3% of weighted transitions. |
| Top-10 recall | 48.9% | The observed destination appeared in the ten highest-ranked candidates in 48.9% of weighted transitions. |
| Top-20 recall | 65.1% | The observed destination appeared in the twenty highest-ranked candidates in 65.1% of weighted transitions. |
| Expected calibration error | 0.0515 | The result narrowly exceeded the preregistered 0.0500 ceiling. |
| Wage-direction accuracy | 61.5% | Among 915 eligible moves, the model matched the direction of the observed destination occupation’s median wage. |
ROC AUC and top-k recall answer different questions. AUC evaluates pairwise ranking across candidate destinations. Top-k recall asks whether the observed destination falls within a shortlist. Neither measure establishes that a destination is advisable, legally accessible, available locally, or feasible for a specific person.
Four gates passed and four failed
| Gate | Frozen requirement | Observed result | Decision |
|---|---|---|---|
| Test size | At least 1,000 changes and 100 origins | 1,021 changes; 121 origins | PASS |
| AUC and baseline improvement | AUC ≥ 0.70 and ≥ 0.05 above employment-size baseline | 0.925 vs. 0.887; improvement 0.038 | FAIL |
| Top-ten retrieval | Top-ten ≥ 20% and ≥ 25% relative improvement over stronger baseline | 48.9% vs. 39.4%; improvement 24.2% | FAIL |
| Calibration | Expected calibration error ≤ 0.050 | 0.0515 | FAIL |
| Wage direction | Accuracy ≥ 55%; two-sided 95% interval excludes 50% | 61.5%; independent interval 57.6%–65.3% | PASS |
| Reported subgroup AUC gap | No reported within-dimension gap > 0.10 without corrective action or scope restriction | Maximum 0.020 | PASS |
| Stable-transition sensitivity | AUC within 0.05 and top-ten at least 75% of primary result | AUC 0.923; top-ten 48.8% | PASS |
| SIPP directional sensitivity | AUC > 0.50 and top-ten at least as high as stronger SIPP baseline | AUC 0.907; top-ten 48.5% vs. 49.8% | FAIL |
The companion workbook records the unrounded values and the exact calculation for each gate.
Why the baseline comparisons matter
An observed destination model can look impressive by learning where many people already work. Large occupations attract more moves simply because they offer more jobs and more hiring opportunities.
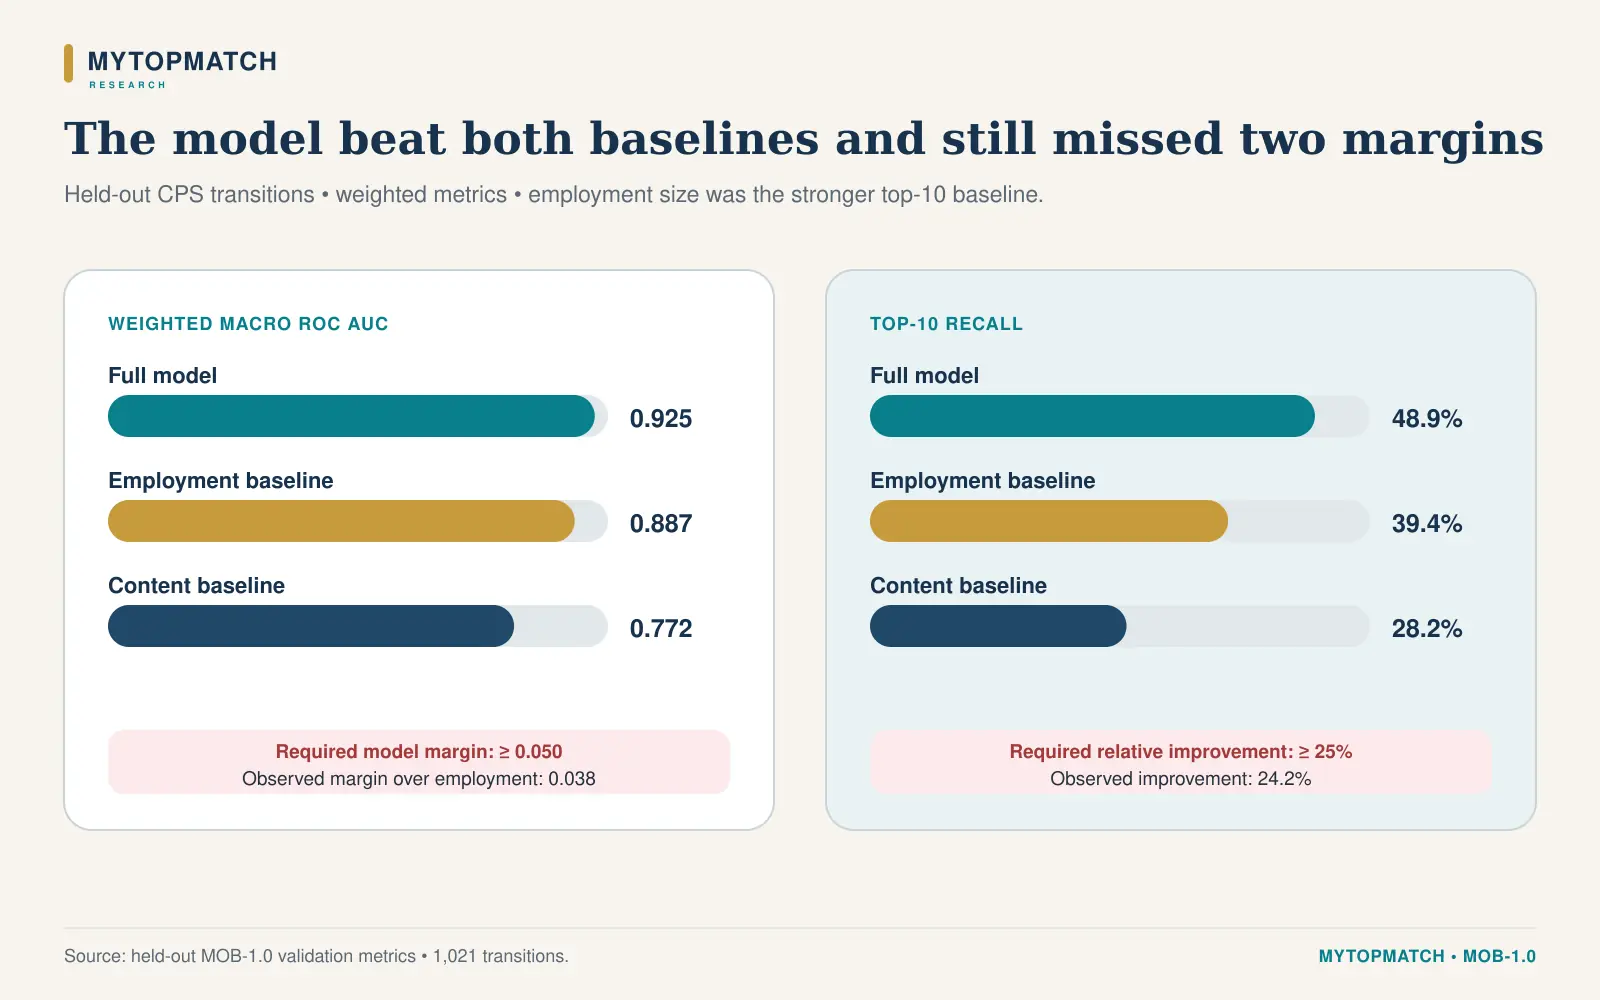
The employment-size baseline reached a weighted macro AUC of 0.887 and top-ten recall of 39.4%. The full model improved AUC by 0.038, short of the 0.050 requirement. Its 48.9% top-ten recall was 24.2% higher than the stronger CPS baseline, just below the required 25% relative improvement.
A content-only baseline, built from occupational similarity without the full set of labor-market features, reached AUC 0.772 and top-ten recall 28.2%. The comparison indicates that occupational content contributes predictive structure. The stronger employment-size result also shows that market prevalence remains a major part of observed mobility.
Calibration was close and still outside the rule
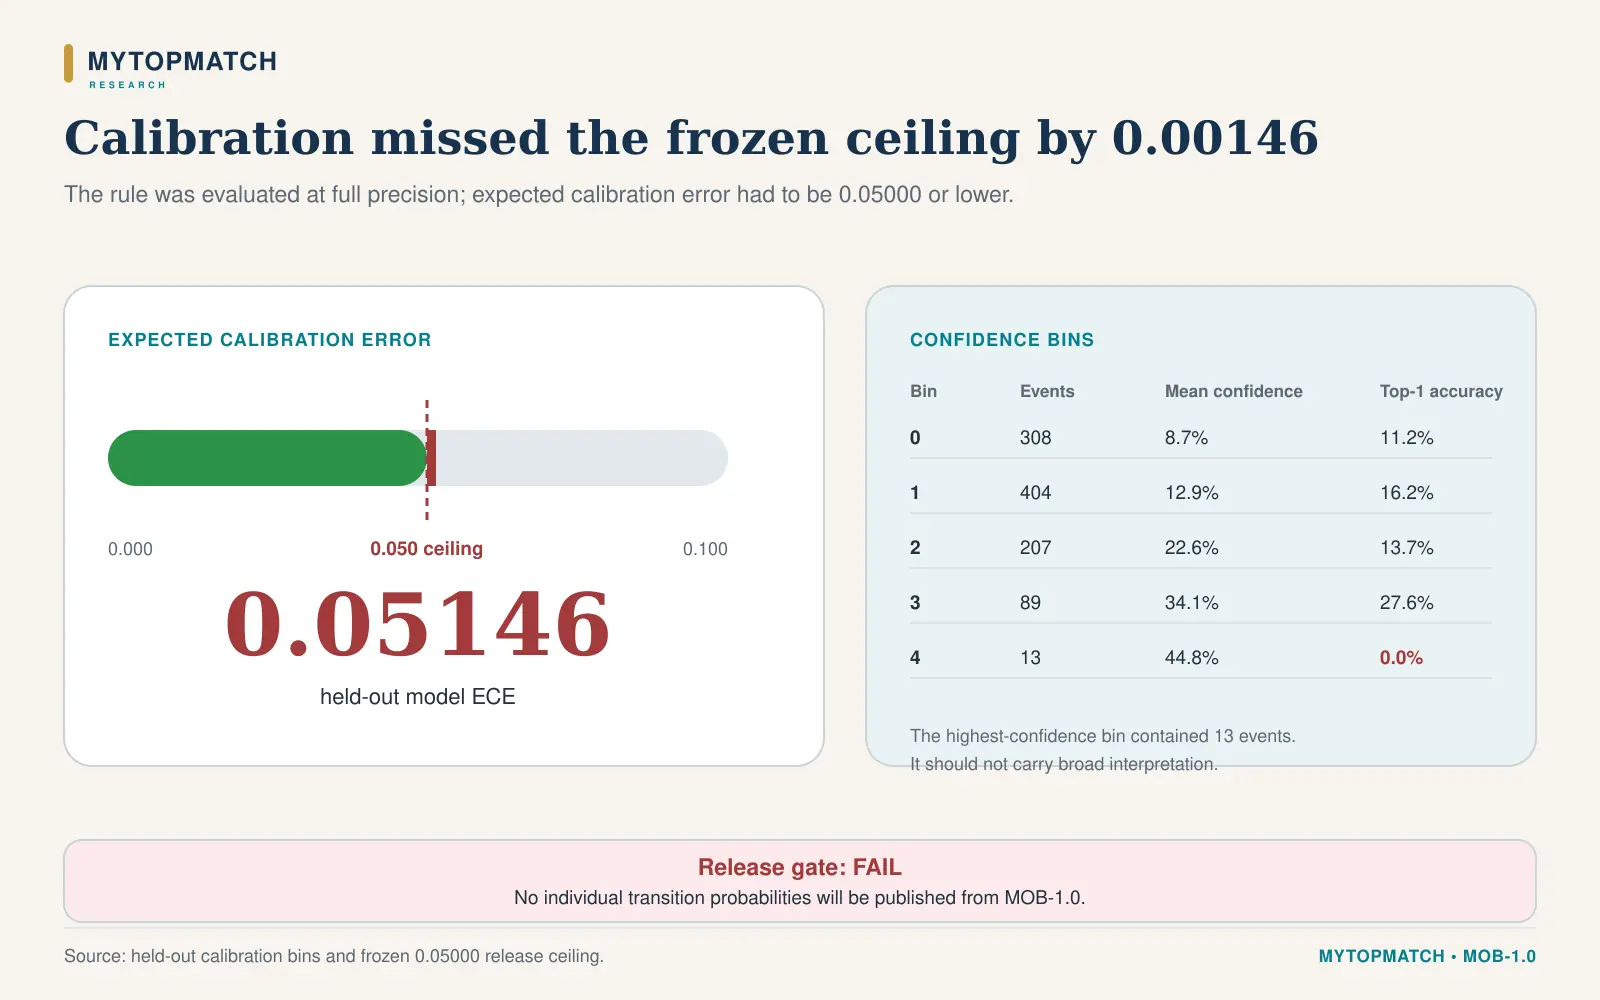
Expected calibration error was 0.05146, approximately 0.00146 above the frozen ceiling. The miss was narrow. The rule applies at full precision.
Calibration is especially important when scores are converted into probabilities. A model can order destinations well while assigning confidence levels that do not align with observed frequencies. MyTopMatch will not publish individual transition probabilities from this model. Even a well-calibrated population model would not, by itself, produce a personal probability of success.
The calibration bins are included in the companion workbook. The highest-confidence bin contained only 13 events, so it should not carry broad interpretation.
The wage-direction check passed, with an important qualification
For transitions with an absolute destination-versus-source OEWS median-wage difference of at least 5%, the model’s highest-ranked destination pointed in the same up-or-down wage direction as the observed move 61.5% of the time. The independent 95% person-cluster interval ranged from 57.6% to 65.3%, excluding 50%.
This gate passed. The content-only baseline reached 63.5%, higher than the full model’s 61.5%, while the employment-size baseline reached 58.8%. The wage-direction test therefore supports directional signal above chance and does not establish superiority over every baseline.
The measure uses occupational median wages from May 2025 OEWS. It does not use a worker’s actual earnings, benefits, hours, bargaining position, or local offer. It cannot estimate the causal pay effect of changing careers (BLS OEWS tables).
Stable-transition and subgroup diagnostics
Occupation codes can change because of reporting or coding noise. The stable-transition sensitivity restricted the test to 541 changes for which the source occupation repeated in the preceding linked month or the destination repeated in the following linked month. Weighted macro AUC remained 0.923 and top-ten recall remained 48.8%, satisfying the frozen sensitivity gate.
Among reportable demographic and credential groups with at least 100 transitions, the maximum within-dimension AUC gap was 0.020. This is below the 0.10 gate. Samples below 100 transitions were suppressed.
That diagnostic is a screening result. It does not prove equal performance for all workers, fairness at the individual level, or adequate measurement for suppressed groups. The model is not approved for individual use.
The SIPP check failed
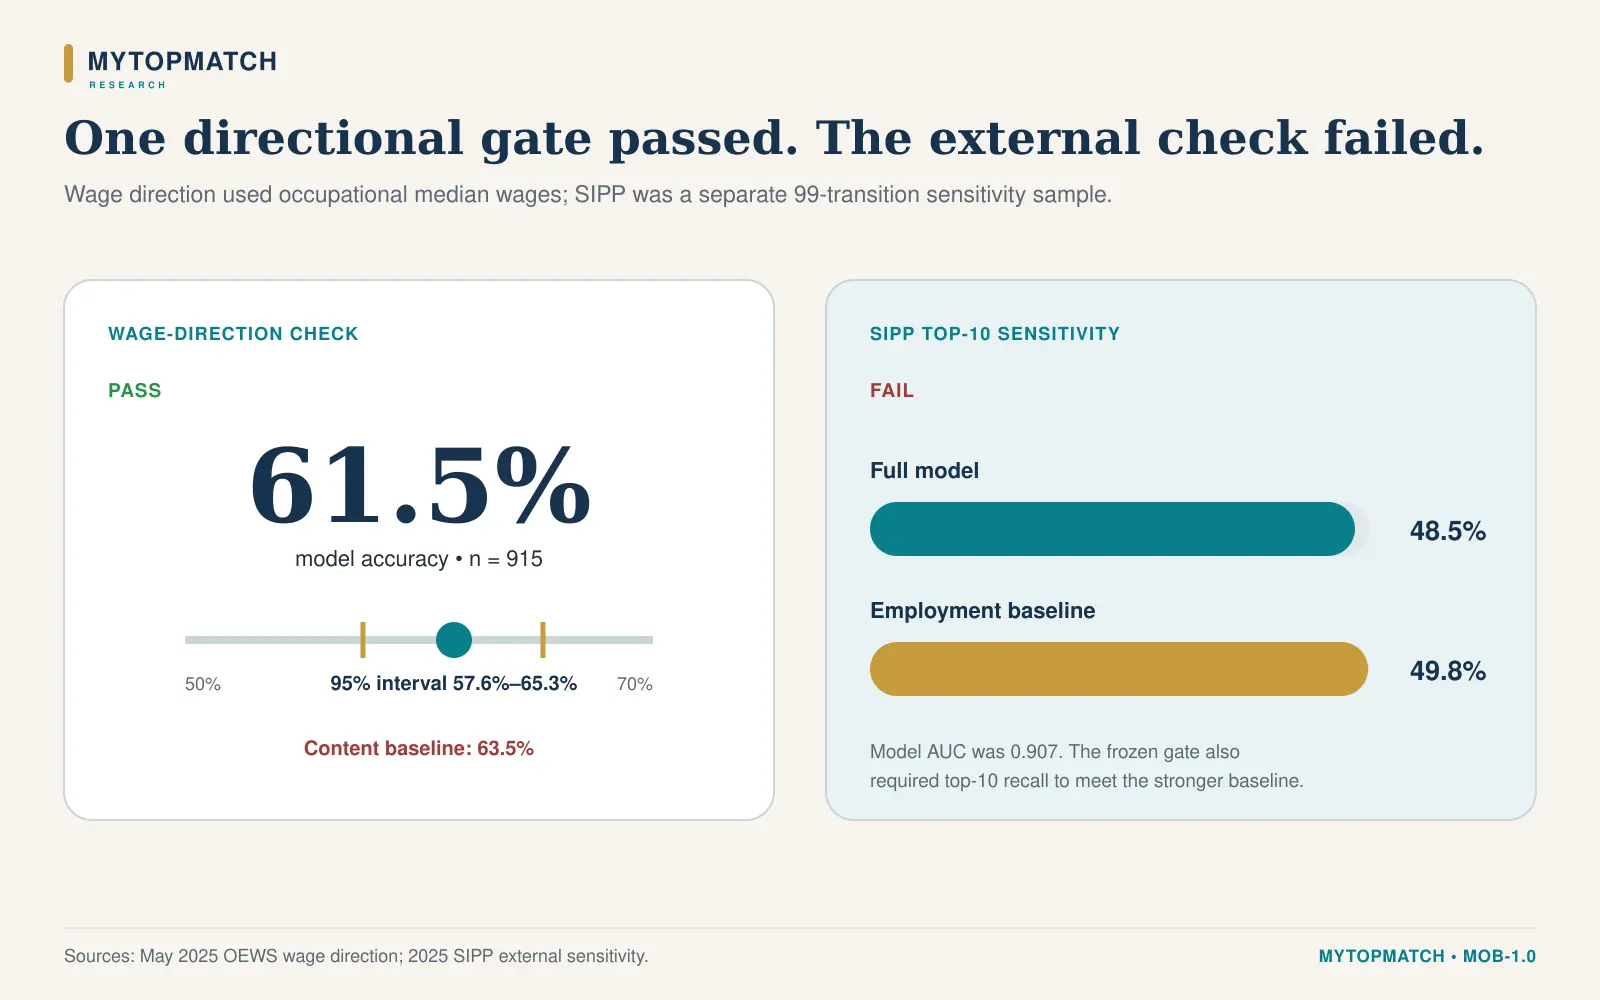
The 2025 Survey of Income and Program Participation provides monthly job states for calendar-year 2024. MyTopMatch constructed a separate 99-transition sensitivity sample spanning 83 people and 46 origin occupations. It was not pooled with CPS, and no person-level cross-survey linkage was attempted.
The full model reached AUC 0.907 and top-ten recall 48.5% in this small sample. The employment-size baseline reached top-ten recall 49.8%. Because the model did not meet or exceed the stronger baseline, the external directional gate failed.
The SIPP result has substantial uncertainty. The Census Bureau notes data-collection complications and a lower-than-average national unit response rate for the 2025 SIPP. Those limits are reasons for caution, not reasons to waive the preregistered gate (2025 SIPP data and release notes).
Why MyTopMatch is withholding rankings
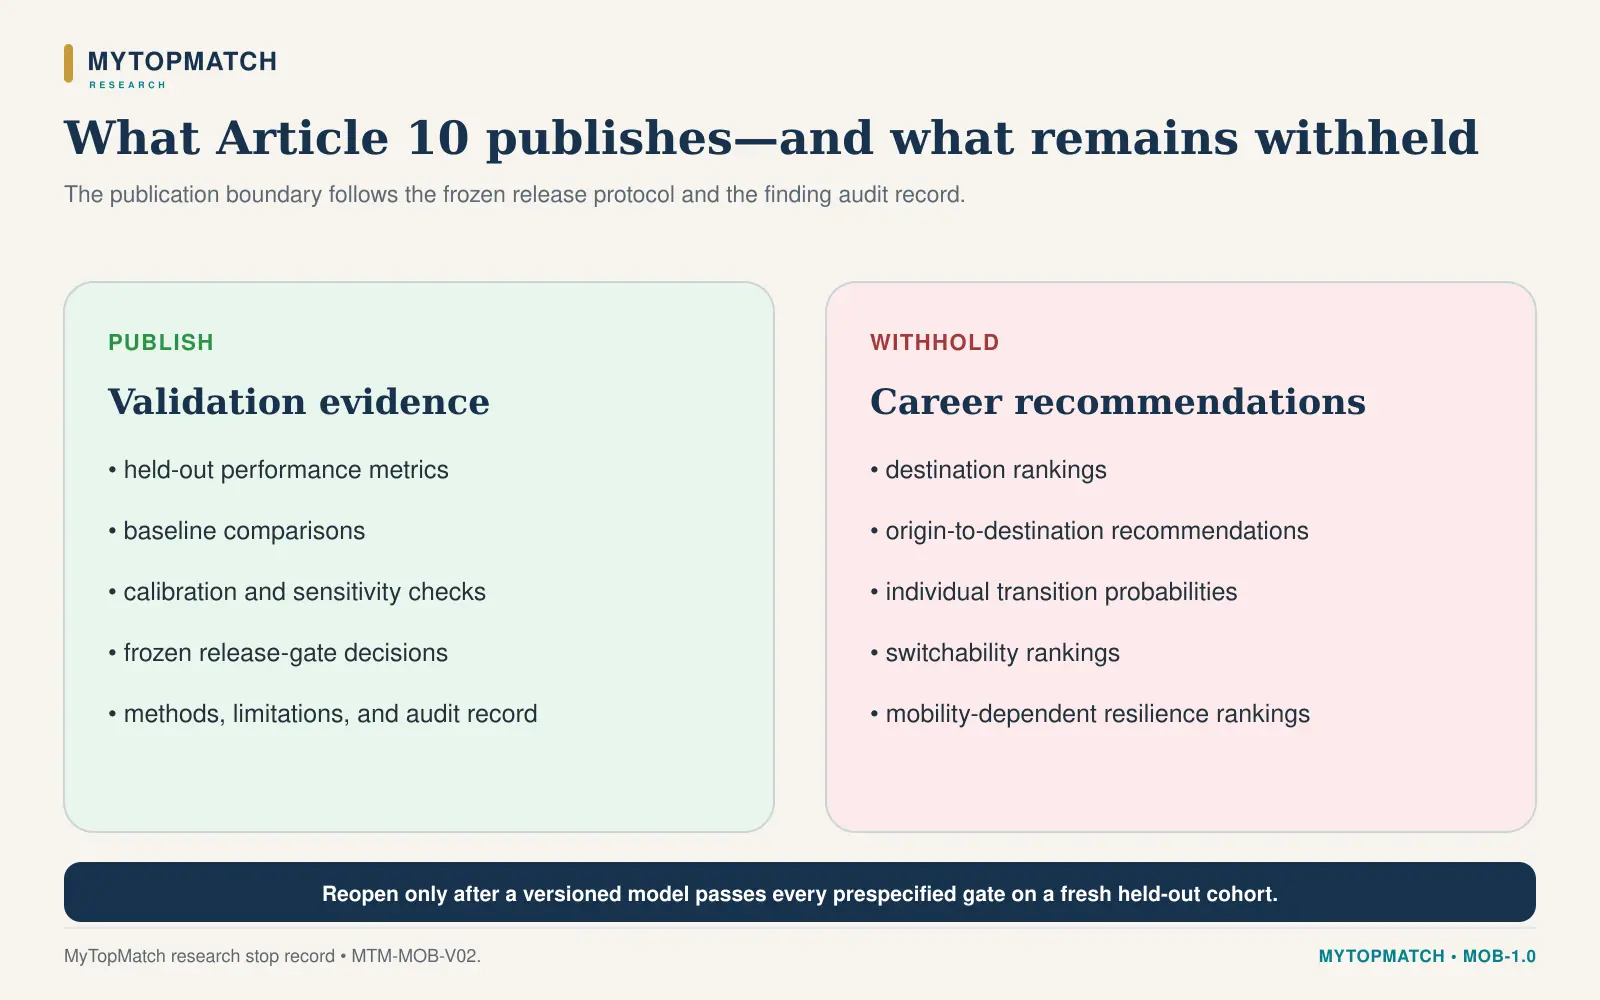
Career Mobility, Career Switchability, and the mobility-dependent portion of Career Resilience rely on credible destination ranks or transition evidence. Publishing occupation lists after a gate failure would make the research rule optional.
Article 10 therefore releases the validation record and the stop decision. It does not release:
- “best career change” lists;
- origin-to-destination recommendations;
- occupational mobility, switchability, or resilience rankings derived from model probabilities;
- individual probabilities of completing a transition;
- claims that observed transitions caused higher pay; or
- claims that similarity alone establishes access.
What the findings mean for workers
The study supports a cautious conclusion: occupational content and labor-market structure can help describe where workers moved in the observed population. The evidence is insufficient to tell an individual where they should move.
A real career decision can depend on location, licensing, scheduling, health, caregiving, discrimination, professional networks, savings, employer demand, and the quality of a specific job offer. Version 1.0 includes no geographic feature and does not observe every practical barrier.
Workers may use the eventual research as one input after the model passes a fresh validation. They should continue to confirm local requirements, compensation, working conditions, and personal constraints directly.
What version 2 must do
The 2026 test cohort is now spent. It cannot be used to choose new features, thresholds, regularization, or calibration and still serve as an untouched test.
Before a second model is fitted, MyTopMatch should freeze a version 2 protocol that:
- defines a fresh, person-disjoint future test cohort;
- expands the number of observed transitions and origin occupations;
- tests rolling or period-specific stability;
- improves probability calibration using validation data only;
- examines prevalence-aware learning and baseline resistance;
- prespecifies any geographic feature and missing-data rule;
- repeats subgroup, stable-transition, and external-survey checks; and
- retains the rule that every analytical gate must pass.
Methodology at a glance
Population
Civilian employed wage-and-salary workers ages 18–64 observed in consecutive CPS months, with Grade A/B occupation mapping and source and destination occupations inside the frozen 350-occupation universe.
Outcome
An observed occupation change occurs when the mapped source and destination National Employment Matrix occupations differ. Same-occupation links remain in descriptive quality assurance and are excluded from destination-choice events.
Model
Symmetric pairwise L2-logistic utility model with twelve prespecified features; 20 sampled negative destinations per training event; training-only scaling; validation-only selection of regularization (C=10) and temperature (1.051196); full 349-candidate softmax evaluation in the test cohort.
Weighting and uncertainty
Headline metrics use CPS weights. Independent uncertainty intervals use 2,000 person-cluster bootstrap draws. The original fitting program used 1,000 person-cluster draws; the independent intervals are reported because they reproduce the same conclusions with more resamples.
Verification
The frozen pipeline’s independent program recorded 22 of 22 successful quality checks, including cohort isolation, count reproduction, metric reconstruction, calibration, interval checks, and the release decision. For Article 10 production, MyTopMatch also reconstructed all eight analytical gates from immutable aggregate outputs using the exact protocol thresholds. The result matched the frozen gate file — four passes, four failures, and a withholding decision.
The current production session verified all 29 files against the release-package manifest. Protected row-level events, person hashes, and transition matrices were not included in the publication package and were not rerun during article production.
Limitations
- Observed moves describe realized transitions, which reflect hiring volume, preferences, constraints, geography, economic conditions, reporting, and coding.
- The model has no geographic feature and cannot represent local vacancies, licensing rules, or commuting constraints.
- CPS adjacent-month linkage is conservative and still subject to linkage and occupation-coding error.
- October 2025 CPS data were unavailable because collection did not occur; missing links were not imputed.
- SIPP contributed only 99 eligible transitions and carried documented response-rate concerns.
- Reportable subgroup comparisons are descriptive diagnostics; smaller groups were suppressed.
- Occupational wage direction uses national median wages and does not represent individual earnings changes.
- Model coefficients are conditional on correlated standardized features and should not be read as causal effects or standalone importance rankings.
- The held-out 2026 test cohort cannot be reused for version 2 tuning.
- A passing future model would still support population-level evidence and would not automatically validate individualized probabilities.
Research status
| Research asset | Status after Article 10 |
|---|---|
| American Career Mobility methods and validation evidence | PUBLISHED — STATUS/METHODS ONLY |
| Career Mobility transition rankings | WITHHELD |
| Career Switchability Index | WITHHELD — DEPENDS ON MOBILITY GATE |
| Mobility-dependent Career Resilience components | WITHHELD — DEPENDS ON MOBILITY GATE |
| Social and press distribution | PAUSED |
Frequently asked questions
Does an AUC of 0.925 mean the model is 92.5% accurate?
No. AUC is a ranking measure, not a percent-correct rate. It reflects how often the observed destination receives a higher score than a nonchosen candidate within the evaluation design.
Does 48.9% top-ten recall mean the model recommends ten careers?
No. The metric checks whether an observed destination appeared among ten research-model candidates. Article 10 does not publish those candidate lists and does not label them recommendations.
Why withhold rankings after narrowly missing two thresholds?
Four gates failed, including external SIPP consistency. The protocol required every gate to pass. Changing the rule after observing results would weaken the validation.
Did the model predict workers’ personal pay changes?
No. The wage-direction check compares national occupational median wages. It does not measure the worker’s actual earnings change.
Can the existing test sample be used to improve the model?
It may inform research hypotheses for a new version. Any change prompted by the test results must be evaluated on a fresh held-out cohort.
When will rankings be released?
Only after a new version passes all frozen analytical gates and completes editorial, data-rights, and owner approval. No date is promised.
Citation and reuse
Suggested citation: MyTopMatch Research. (2026). “A Promising Career-Mobility Model Is Not Yet Ready to Recommend Job Changes.” MyTopMatch. https://mytopmatch.com/publications/career-mobility-model-validation-2026
When reusing findings, identify the work as original analysis by MyTopMatch Research, identify the underlying public data publisher where relevant, and link to this canonical article. Source publishers do not endorse MyTopMatch's calculations or interpretations.