
Career rankings often arrive as a clean numbered list. The first occupation appears stronger than the second, the 25th appears stronger than the 26th, and every position looks equally precise.
A MyTopMatch analysis shows why readers should be more cautious.
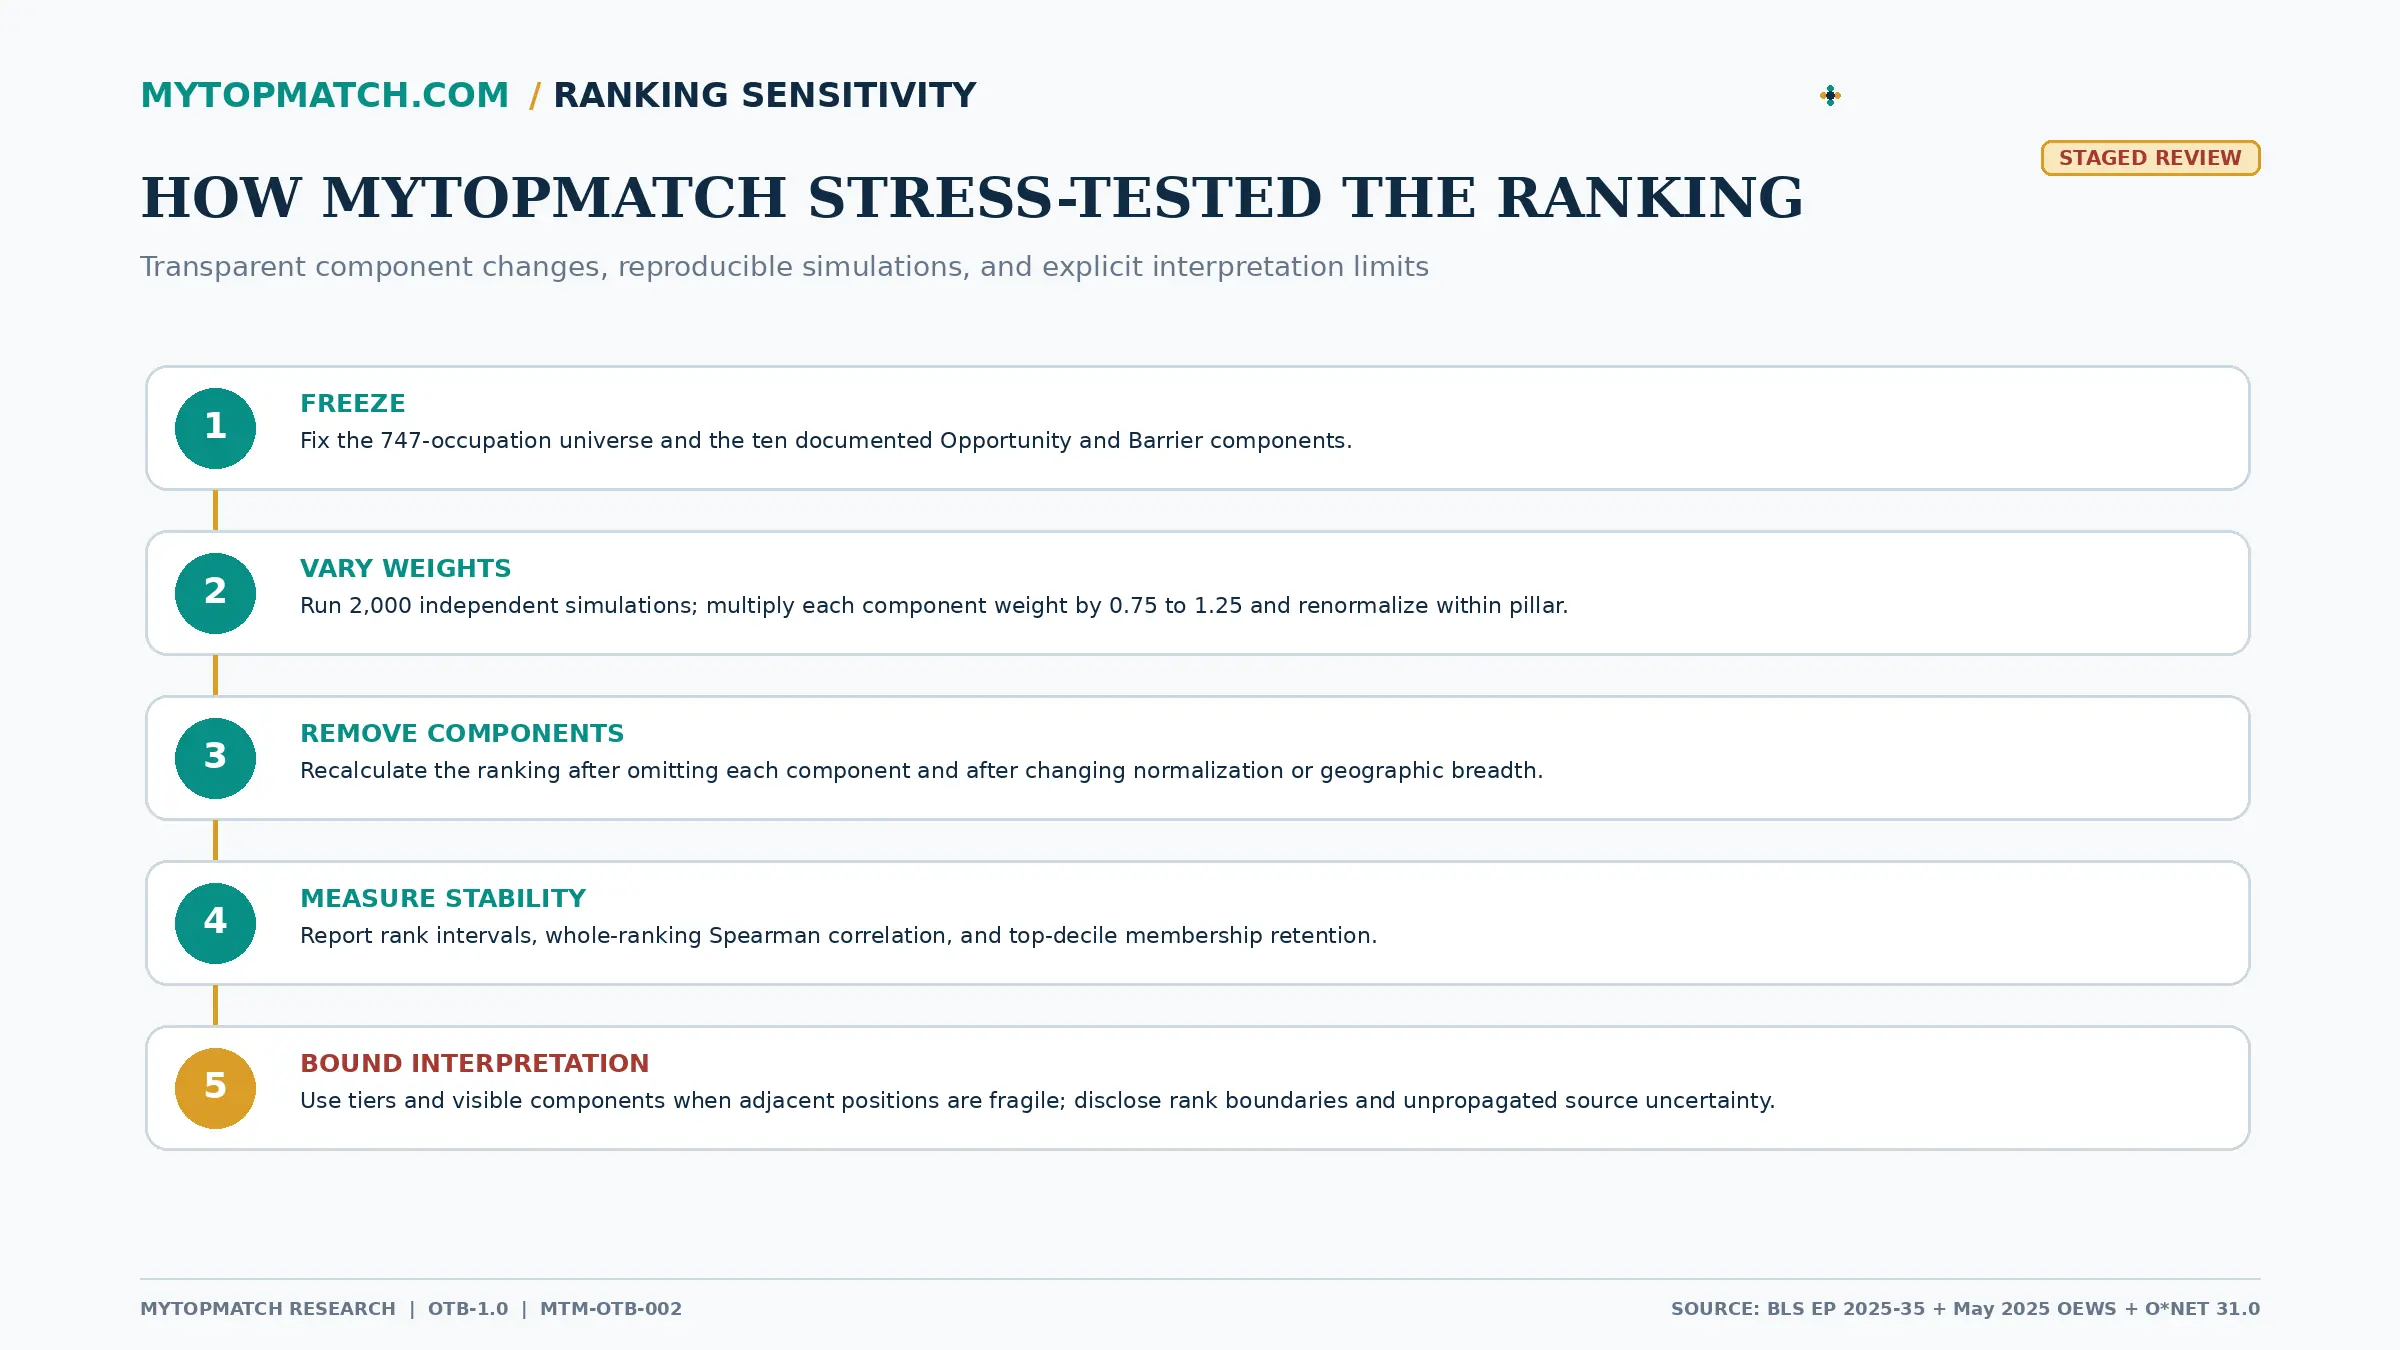
We stress-tested the 2026 MyTopMatch Opportunity-to-Barrier analysis across 747 detailed occupations. The index combines six measures of opportunity with four measures of formal entry barriers. We then ran 2,000 reasonable weight variations, removed each component one at a time, and tested alternate ways to normalize and measure the inputs.
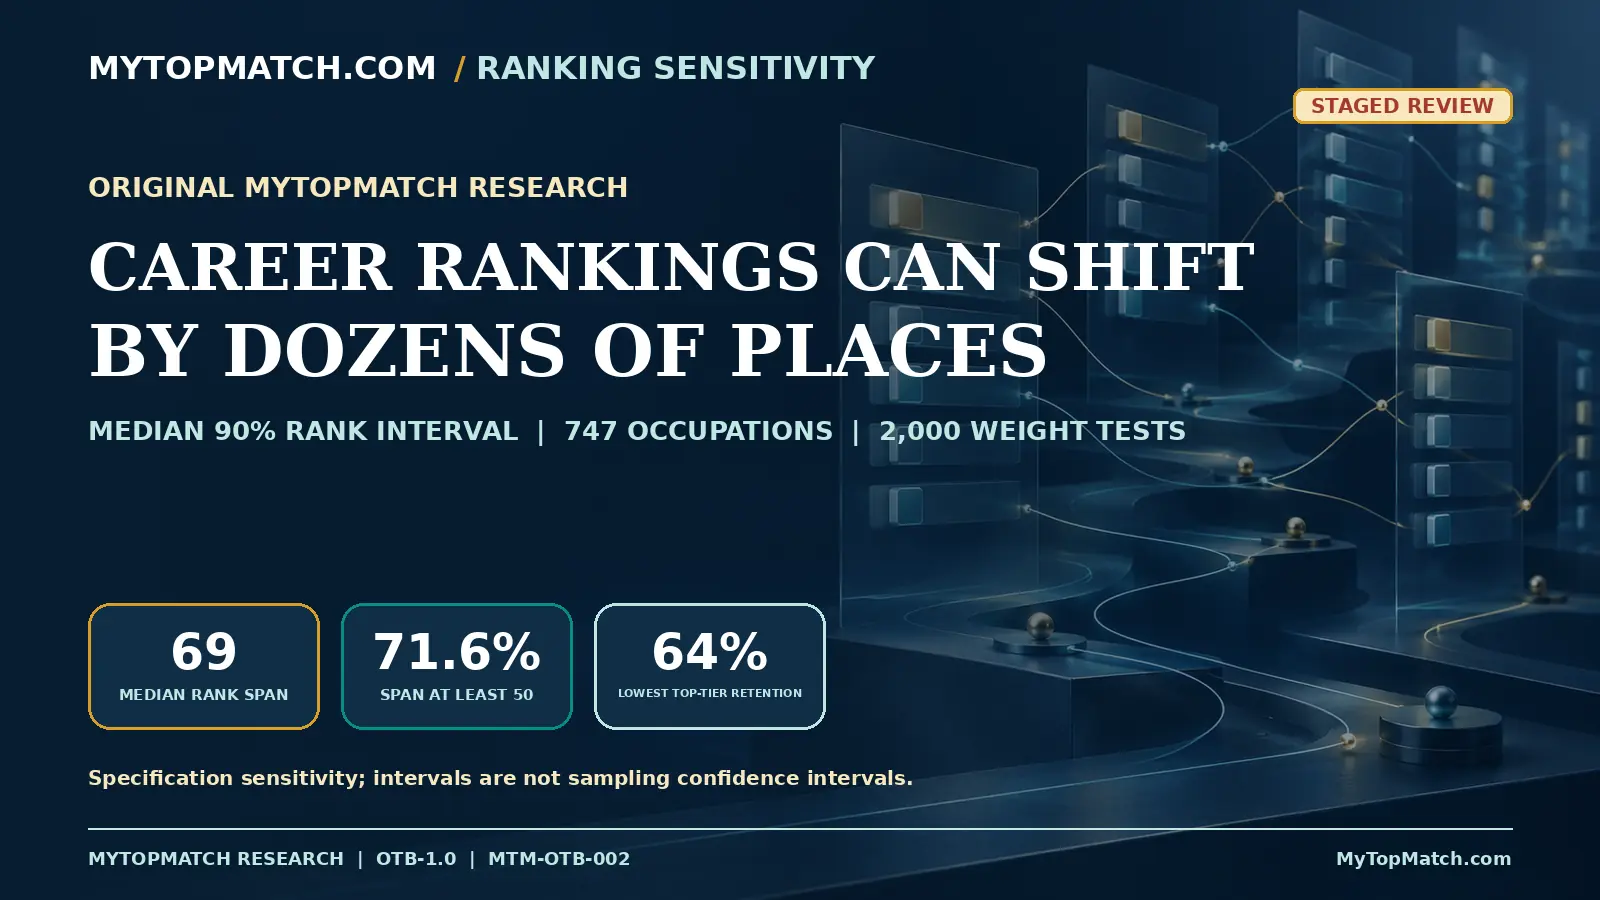
The central result: the median occupation's 90% rank interval spanned 69 positions when component weights changed within the tested range.
The result does not make career rankings useless. It changes how a responsible ranking should be presented. Stable leaders deserve attention. Broad tiers can support comparison. A one-position difference in the middle of a table may have little practical meaning.
The finding at a glance
| Measure | Result | Evidence class |
|---|---|---|
| Eligible detailed occupations | 747 | Derived analytical sample |
| Component-weight simulations | 2,000 | Method specification |
| Weight variation | Each component multiplied by 0.75–1.25, then renormalized within pillar | Method specification |
| Median 5th-to-95th percentile rank-interval width | 69 positions | Statistical finding |
| Occupations with intervals at least 50 positions wide | 71.6% | Derived calculation |
| Occupations with intervals at least 100 positions wide | 15.3% | Derived calculation |
| Lowest whole-ranking Spearman correlation | 0.892 | Statistical finding |
| Weakest top-decile retention | 64%, or 48 of 75 occupations | Statistical finding |
| Primary top-ten median interval width | 2.5 positions | Statistical finding |
| Primary leader under weight simulations | Rank 1–1 | Statistical finding |
Source data — BLS Employment Projections 2025–35 supply employment, projected growth, annual openings, and typical entry requirements. May 2025 BLS OEWS supplies median wages, employment, and state reporting breadth. O*NET 31.0 supplies Job Zone. [1][2][3][4]
Derived calculations: MyTopMatch transforms ten documented components to comparable 0–100 scores, creates separate Opportunity and Barrier pillars, calculates Opportunity Efficiency, and measures rank movement across alternate specifications.
Statistical findings: Rank correlations, top-decile retention, and 5th-to-95th percentile rank intervals quantify sensitivity to reasonable modeling choices. These are specification tests rather than sampling confidence intervals.
Interpretation: The full ordering can remain broadly similar while many occupations near a cutoff change categories. Responsible publication requires more than a single numbered list.
A high correlation can hide important turnover
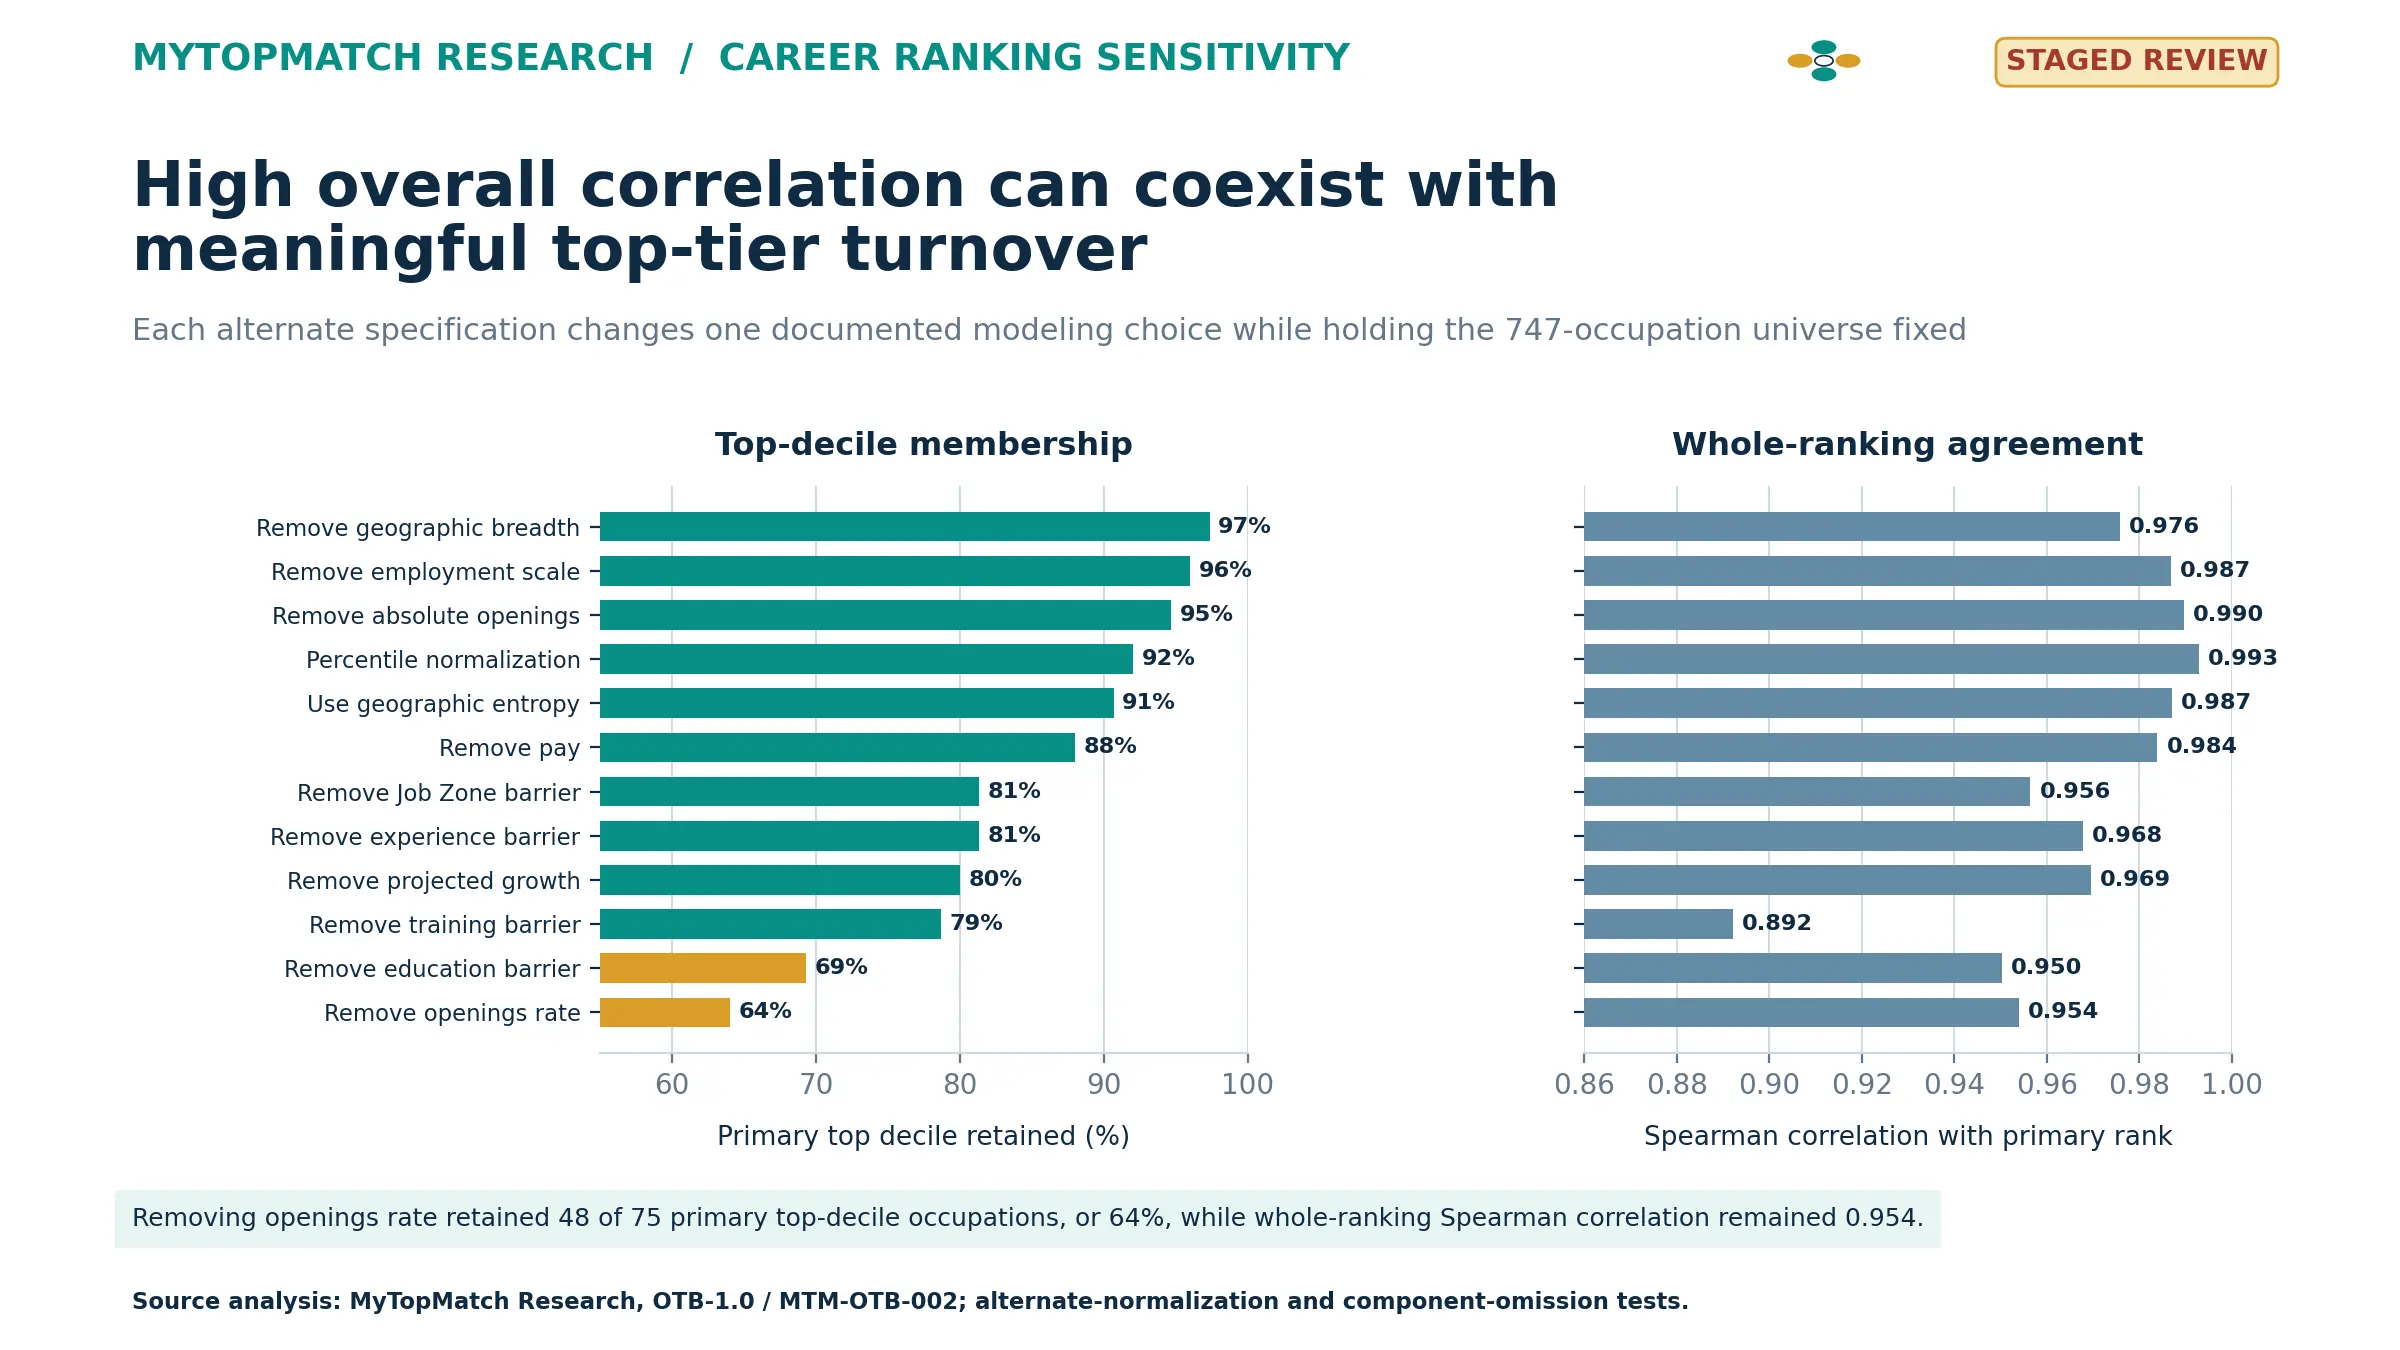
Across the component-omission tests, the lowest Spearman correlation between an alternate ranking and the primary ranking was 0.892. In many settings, that would be described as strong agreement.
Whole-table agreement answers one question: do occupations generally remain in a similar order? A top-decile threshold answers another: do the same occupations remain inside the group being promoted as the leaders?
Those answers diverged. Removing the openings-rate component retained only 48 of the 75 primary top-decile occupations. Twenty-seven occupations left the group and were replaced. The top-decile retention rate was 64%, even though the whole-ranking Spearman correlation for that specification remained 0.954.
Figure 1. Alternate specifications: top-decile retention and whole-ranking agreement.
The weakest whole-ranking correlation came from removing the training-barrier component. Spearman correlation fell to 0.892, while top-decile retention remained 78.7%. Removing the education-barrier component retained 69.3% of the primary top decile. Substituting percentile normalization retained 92%.
This distinction matters for any published list. A high overall correlation can coexist with meaningful turnover at the line where a publisher declares “top 10%,” “best,” or “recommended.” Threshold stability should be tested directly.
Most occupations moved across a wide range
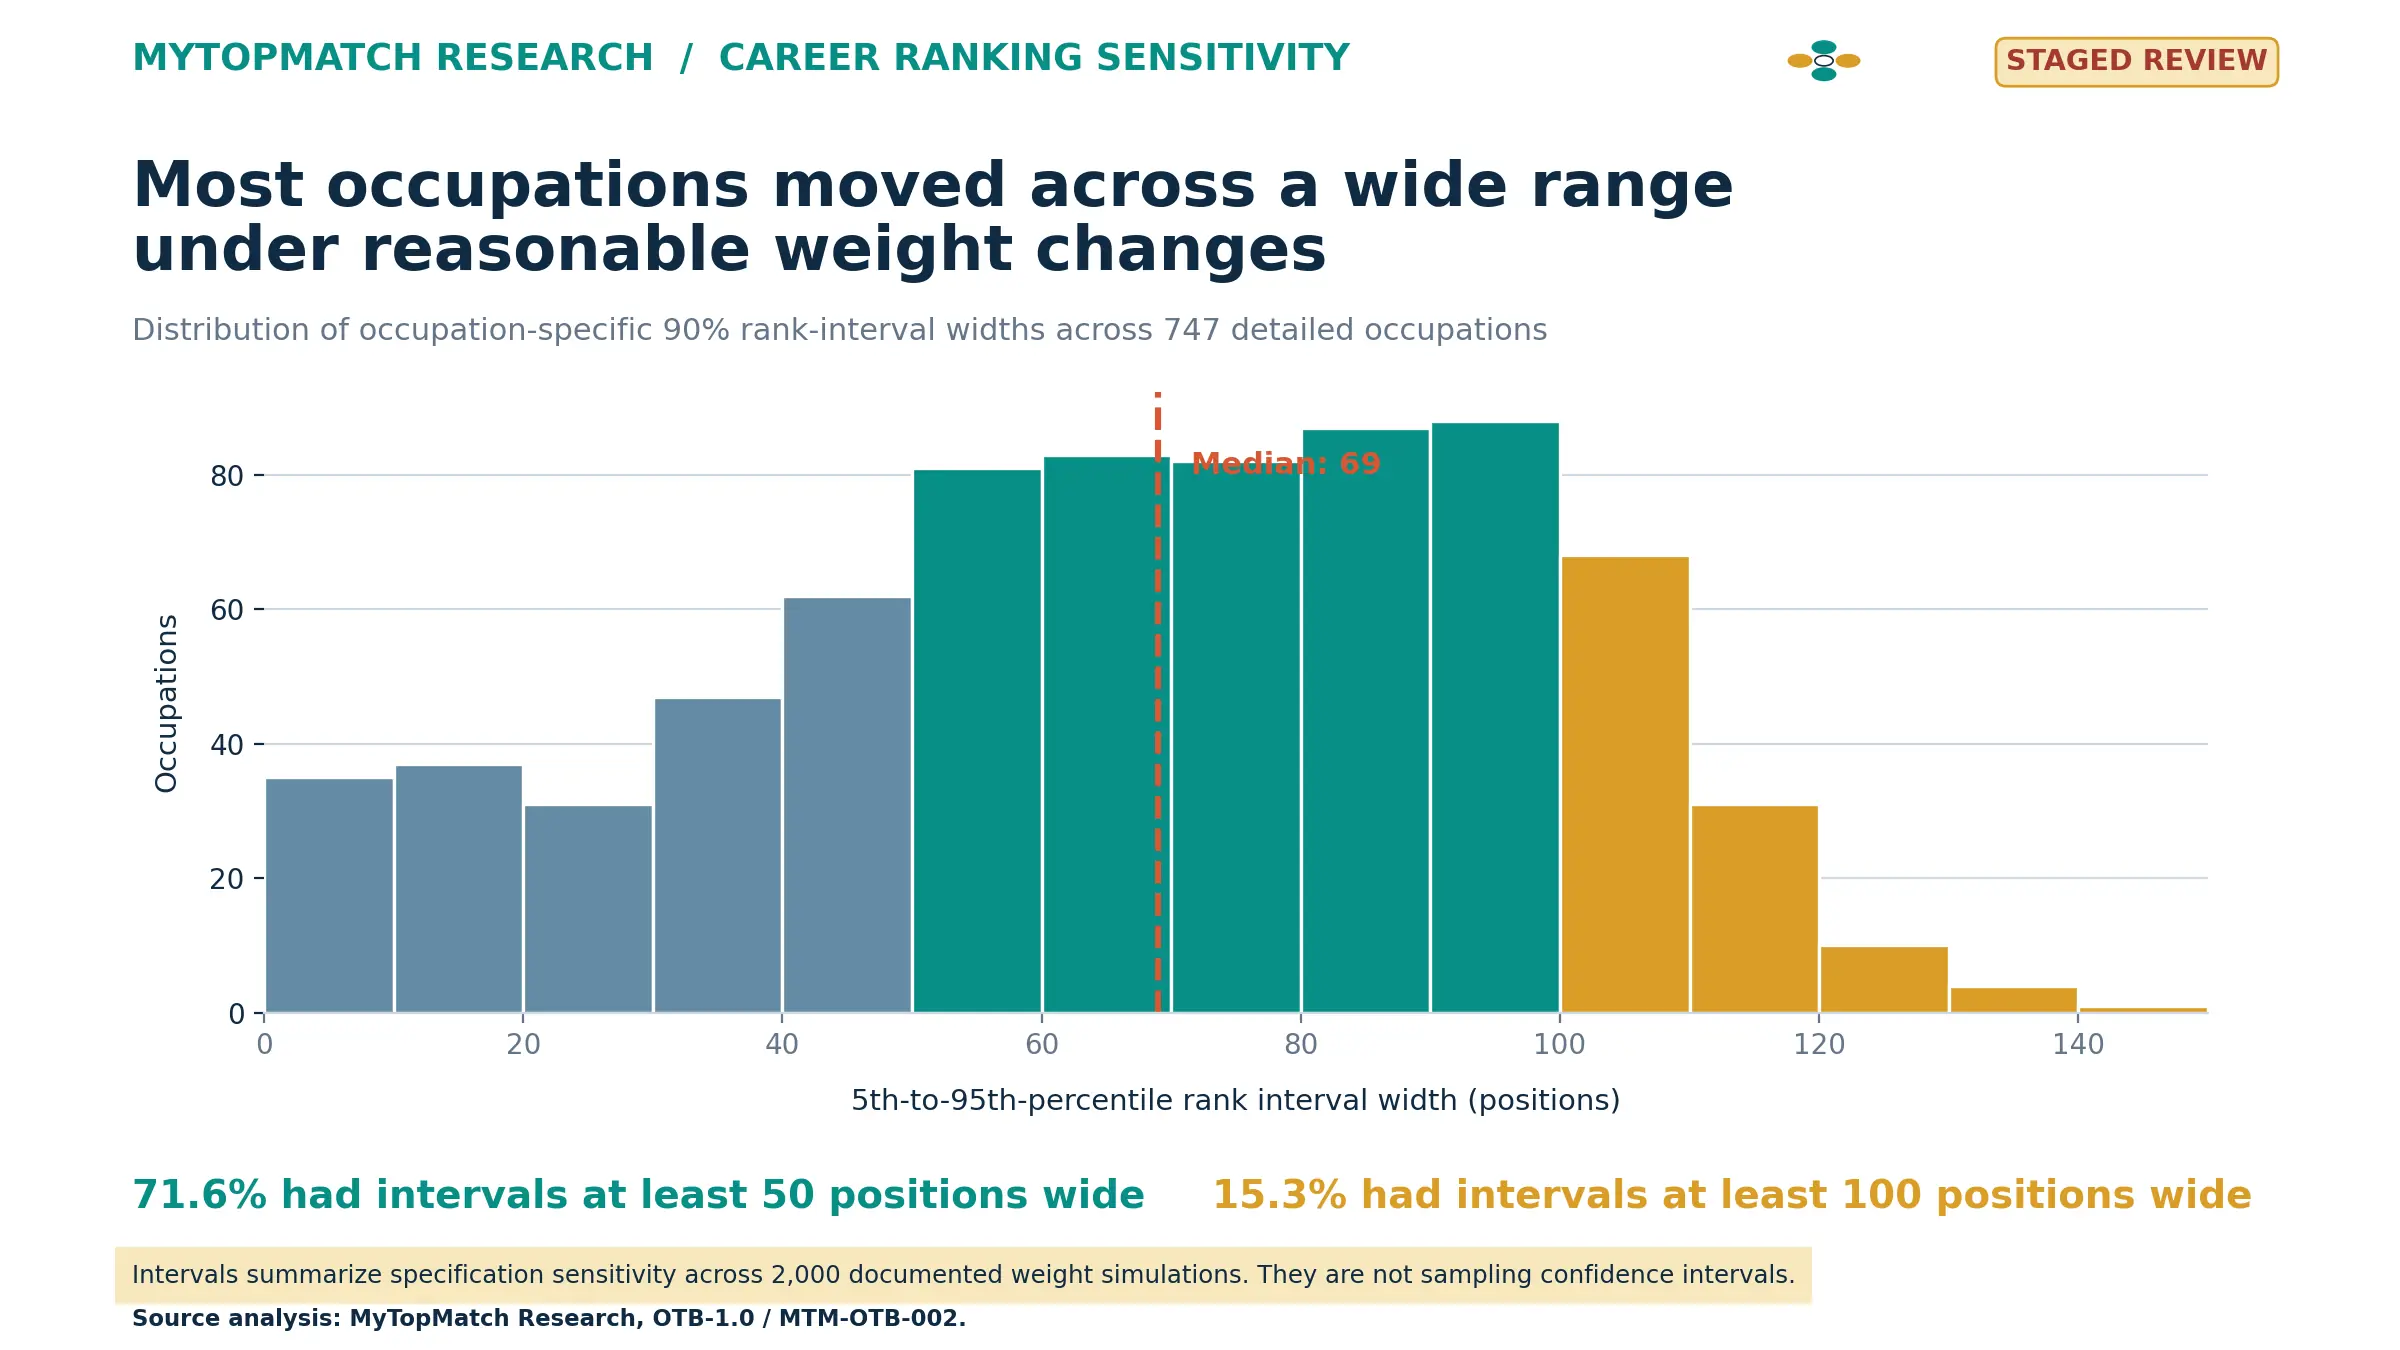
For each occupation, MyTopMatch recorded its rank in every weight simulation. The published interval runs from the 5th percentile to the 95th percentile of those 2,000 ranks.
Across all occupations:
- the median interval width was 69 positions;
- 71.6% had an interval at least 50 positions wide; and
- 15.3% had an interval at least 100 positions wide.
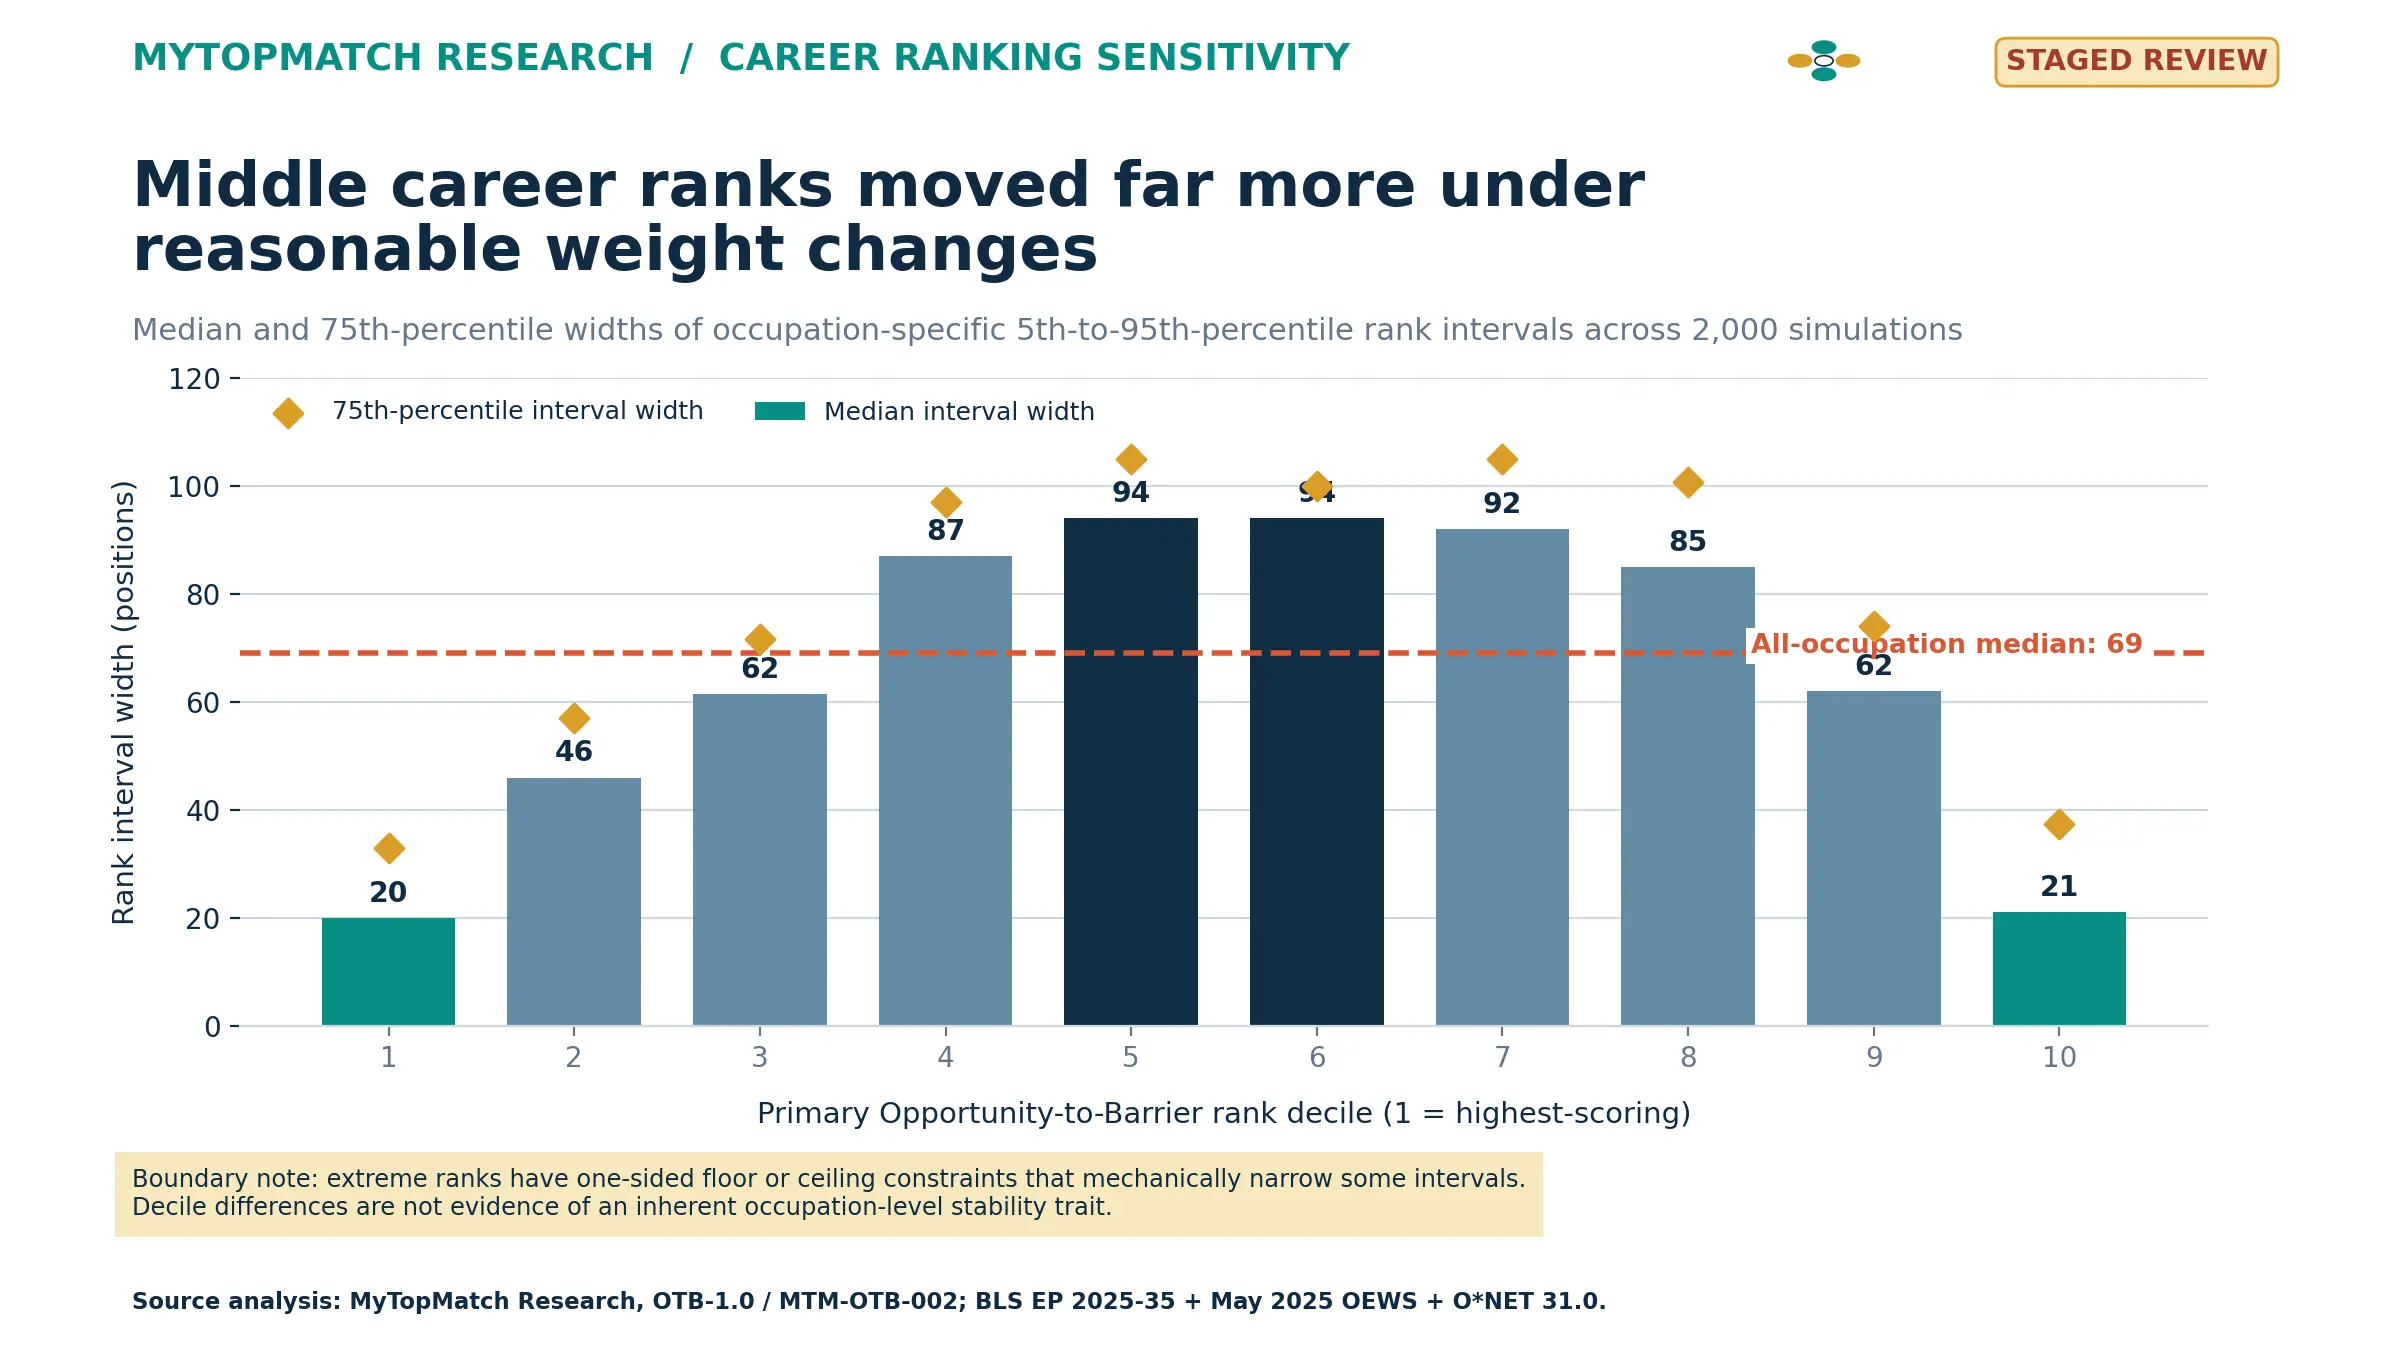
The middle of the ranking was especially sensitive. Occupations in the fifth and sixth primary-rank deciles had a median interval width of 94 positions. The first decile's median was 20, and the tenth decile's median was about 21.
Part of the extreme-versus-middle difference is mechanical. Rank 1 cannot move upward, and rank 747 cannot move downward. The boundaries naturally narrow some intervals. The finding therefore supports caution about middle-rank precision; it does not prove that high- or low-ranked occupations possess an inherent stability trait.
Figure 2. Median 90% rank-interval width by primary rank decile.
One leader remained unusually stable
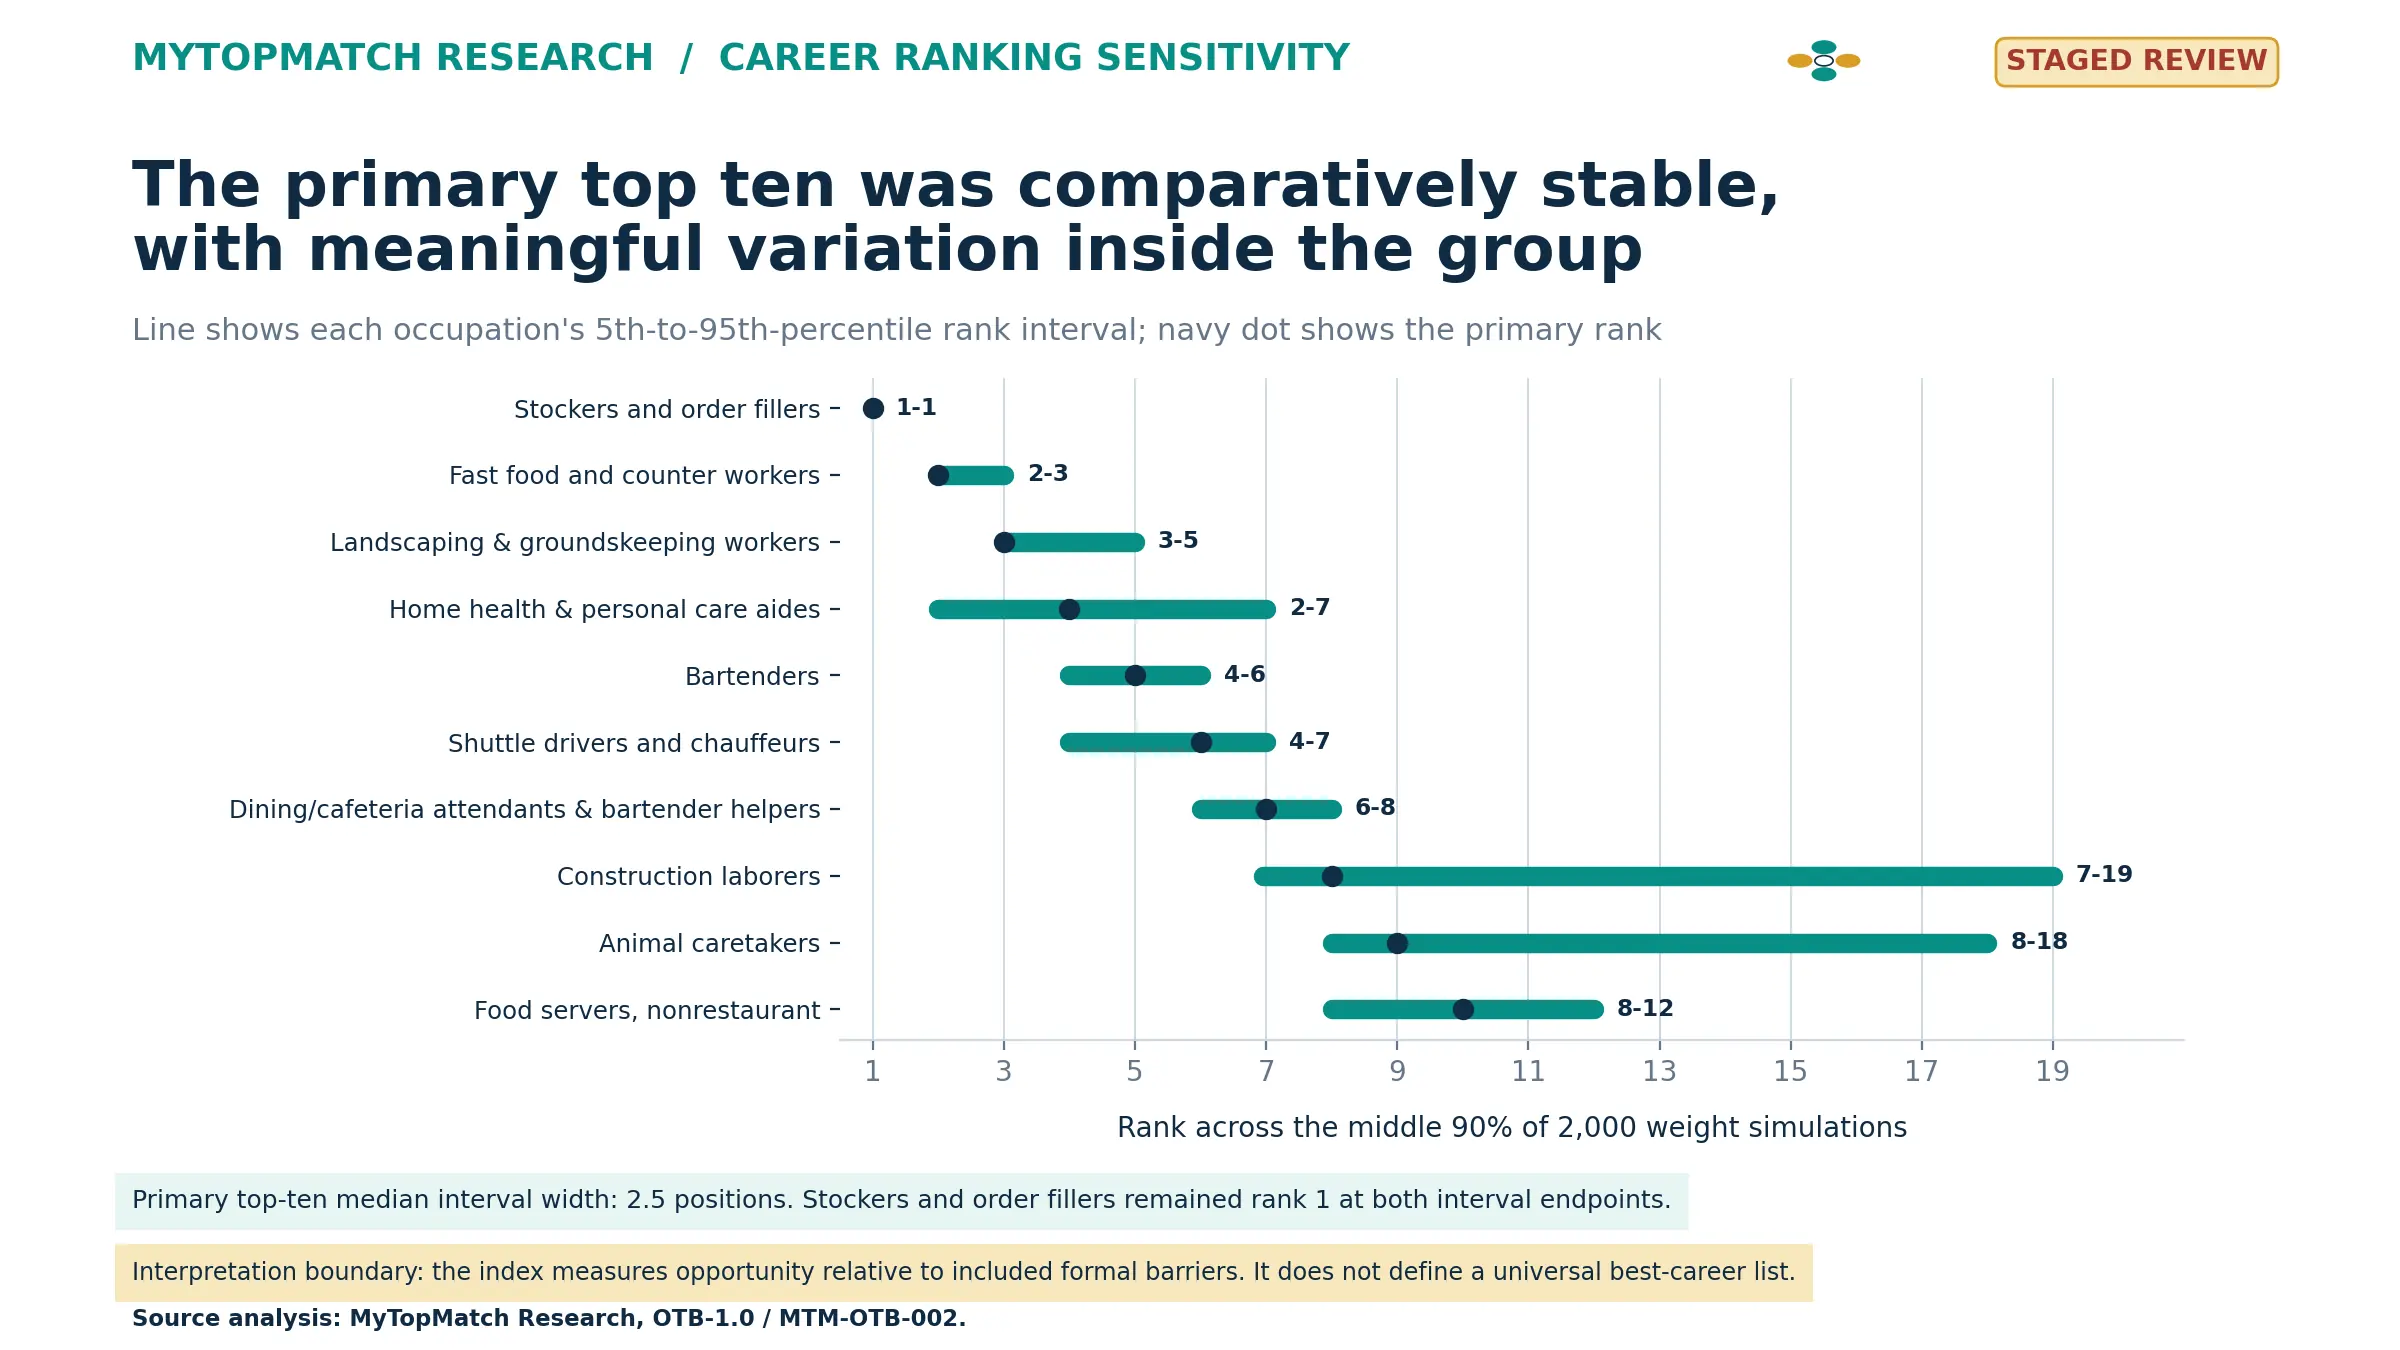
Stockers and order fillers ranked first in the primary Opportunity-to-Barrier analysis. The occupation remained rank 1 at both the 5th and 95th percentile of the 2,000 weight simulations. Across the component-omission tests, it ranged from rank 1 to rank 4.
The result is strong within the defined construct. Stockers combine large projected openings, substantial employment scale, wide geographic availability, and low measured formal entry barriers. Their pay component scores poorly. High openings can also reflect turnover or job-quality problems that the index does not measure.
This is why MyTopMatch publishes the Opportunity and Barrier pillars separately. The number summarizes opportunity relative to formal barriers. It does not evaluate benefits, schedules, physical demands, injury risk, stability, worker preferences, individual fit, or the quality of a particular employer.
The ranking supports a precise statement: stockers and order fillers are the most stable leader under the tested Opportunity-to-Barrier specifications. It does not support a broad claim that the occupation is America's best career.
What changed the rankings most
The stress tests reveal which design choices carry the most influence.
Openings rate changed top-tier membership
Removing openings rate produced the weakest top-decile retention, at 64%. Openings rate differs from absolute openings. An occupation can have many openings because it is very large, while another can have fewer openings yet a high number relative to its employment base.
The index includes both measures because they answer different questions. The sensitivity result shows that publishers should reveal both components rather than compressing them into an unexplained demand score.
Training changed the whole ordering
Removing the training-barrier component produced the lowest whole-ranking correlation, 0.892. BLS categories distinguish typical on-the-job training needed to attain competency, including short-, moderate-, and long-term training and apprenticeships. The result suggests that how a model represents workplace preparation can materially affect its overall ordering.
Education changed the top group
Removing the education-barrier component retained 69.3% of the primary top decile. Education is a powerful structural divider across occupations, and BLS describes its category as the education level typically needed for entry. It does not describe every employer's requirement or the education held by every incumbent worker.
Normalization mattered less than component presence
Replacing the primary robust-CDF normalization with percentile ranks produced a whole-ranking correlation of 0.993 and retained 92% of the top decile. In this run, whether a component was included often mattered more than the choice between these two reasonable normalizations.
How the index works
The Opportunity pillar contains six components:
- median pay;
- projected annual openings relative to employment;
- absolute annual openings on a logarithmic scale;
- projected employment growth;
- occupational employment scale; and
- geographic breadth across states with reportable employment.
The Barrier pillar contains four components:
- BLS typical education needed for entry;
- BLS related work experience typically required;
- BLS on-the-job training typically needed for competency; and
- O*NET Job Zone.
Each raw component is transformed to a 0–100 score with a robust z score and the normal cumulative distribution function. Components receive equal weights within their pillar. The primary score is:
Opportunity Efficiency = 50 + 0.5 × (Opportunity Score − Barrier Score)
The scale is bounded from 0 to 100. Higher values indicate stronger measured opportunity relative to the included formal barriers.
For each of the 2,000 weight simulations, the six Opportunity weights and four Barrier weights were independently multiplied by values drawn uniformly from 0.75 to 1.25, then renormalized to sum to one within each pillar. The random seed was fixed at 20260906, making the published simulation exactly reproducible from the frozen component scores.
What the stress test establishes
The analysis establishes four findings within its defined scope:
- reasonable weight changes produce substantial rank uncertainty for many occupations;
- whole-ranking correlation can conceal instability at a top-tier threshold;
- component inclusion affects the ranking more than small differences between adjacent positions suggest; and
- some leaders remain stable enough to support a specific, qualified headline.
The analysis does not establish a universal best-career ordering. It also does not estimate sampling-error confidence intervals around every component, predict an individual's success, measure employer-specific hiring standards, or capture every dimension of job quality.
How workers can use a career ranking responsibly
Treat a ranking as a structured starting point.
- Inspect the components. A high composite may come from openings and low formal barriers even when pay is modest.
- Prefer tiers to tiny rank differences. Two occupations separated by one or two positions may reverse under equally defensible assumptions.
- Choose personal weights deliberately. Pay, preparation time, geography, schedule, physical demands, and stability do not have the same value for every worker.
- Check the occupation locally. National projections and wages do not guarantee an opening or salary in a particular labor market.
- Verify hard requirements. Licensing, certifications, background rules, and employer requirements need occupation- and location-specific confirmation.
- Use transition evidence for career changes. Occupational attractiveness does not show that a particular worker can enter the occupation from a specific starting point.
How employers and workforce organizations can use the findings
The same discipline applies to workforce dashboards and talent programs.
- Show the ingredients behind any composite workforce score.
- Test membership in priority tiers under alternate assumptions.
- Separate projected occupational openings from current posted vacancies.
- Keep BLS typical-entry requirements distinct from employer-specific requirements and incumbent education.
- Use occupation-level research to frame questions for local employer data, program outcomes, and worker-transition evidence.
An index is most useful when users can see why an occupation scores well and how much the conclusion changes under reasonable alternatives.
Methodology
Data sources and current versions
- BLS Employment Projections 2025–35: Table 1.2 provides 2025 and 2035 employment, employment change, annual average occupational openings, 2025 median annual wages, and typical education, work-experience, and on-the-job-training requirements. BLS last modified the table on August 27, 2026. [1]
- BLS OEWS May 2025: the current tables provide national and state occupational employment and wage estimates. BLS released the May 2025 estimates on May 15, 2026. The estimates use the 2018 SOC and a model-based method drawing on three years of survey data. [2][3]
- O*NET 31.0: the current production database was released in August 2026 and provides Job Zone values used in the Barrier pillar. [4][5]
Analytical universe
The starting BLS projections file contains 831 detailed line-item occupations. The complete-case index includes 747 with all ten required component values. Missing values were not imputed for index eligibility.
Primary specification
Opportunity and Barrier remain visible as separate pillars. Each component is normalized with the same robust-CDF process, and the components receive equal weights within their pillar. Occupational size enters through a logarithmic employment-scale component to reduce domination by the largest occupations.
Robustness specifications
The analysis includes:
- percentile normalization instead of the robust CDF;
- removal of each component one at a time;
- geographic entropy instead of state reporting coverage;
- an Employment-Projections-only barrier specification; and
- 2,000 independent plus-or-minus-25% component-weight perturbations.
For alternate deterministic specifications, the study reports Spearman correlation with the primary rank and the share of the 75 primary top-decile occupations that remain in the alternate top decile. For weight simulations, it reports each occupation's 5th, 50th, and 95th percentile rank and its probability of appearing in the top decile.
Reproducibility verification
The Article #8 audit independently recomputed the primary formula, all 747 deterministic alternate-rank comparisons, and the 2,000 weight simulations from the frozen component scores. The reproduced 5th, 50th, and 95th percentile ranks matched the stored analysis exactly. The maximum absolute difference in the primary score formula was below 3 × 10^-14, consistent with floating-point rounding.
Interpretation rules
- Rank intervals are specification-sensitivity intervals, not sampling confidence intervals.
- Exact adjacent ranks are withheld when reasonable alternatives materially reorder occupations.
- Stable tiers and component values receive priority over a single composite rank.
- The index is never described as a universal best-career measure.
- Openings are BLS projected annual openings, not current vacancies or job advertisements.
Limitations
The analysis does not propagate every OEWS sampling error or BLS projection uncertainty through the final index. O*NET content has occupation-specific update cycles and maps detailed O*NET-SOC occupations to the BLS taxonomy. Geographic breadth depends on reportable OEWS state estimates and can reflect suppression as well as true market coverage.
The index excludes benefits, schedules, hours, remote-work access, physical demands, injury risk, unionization, worker preferences, employer quality, and comprehensive licensing requirements. High openings can reflect growth, replacement, turnover, or difficult working conditions. BLS projections describe a modeled future, and OEWS estimates describe wage-and-salary jobs within the program's scope.
The plus-or-minus-25% weight range is a transparent stress test. It is not a probability distribution of public preferences. A reader who assigns radically different importance to pay, education, or openings can produce a different ordering.
FAQ
Does a 69-position interval mean every occupation moved exactly 69 places?
No. Sixty-nine is the median width across 747 occupation-specific 5th-to-95th percentile rank intervals. Some intervals were narrower and others were wider.
Is the interval a 90% confidence interval?
No. It summarizes rank variation across 2,000 documented weight choices. It does not estimate repeated-sample uncertainty in the source surveys.
Why publish any ranking if positions can change?
Composite rankings can organize multidimensional evidence when their components and uncertainty remain visible. Stable leaders, broad tiers, and component profiles can still be informative.
Does the first-ranked occupation have the highest pay?
No. Pay is one of six Opportunity components. Stockers and order fillers led through scale, openings, geographic breadth, and low measured formal barriers while scoring low on pay.
Can the index tell me which career I should choose?
No. It is an occupation-level comparison. A personal decision requires local opportunities, verified requirements, preferences, constraints, finances, and a realistic transition path.
Citation and reuse
Suggested citation: MyTopMatch Research. (2026). “Career Rankings Can Shift by Dozens of Places When the Formula Changes.” MyTopMatch. https://mytopmatch.com/publications/career-ranking-sensitivity-analysis-2026
When reusing findings, identify the work as original analysis by MyTopMatch Research, identify the underlying public data publisher where relevant, and link to this canonical article. Source publishers do not endorse MyTopMatch's calculations or interpretations.