
Research edition: OTB-1.0 / Ranking Sensitivity Note 1.0. Analysis frozen September 7, 2026.
Before you let a ranking change your career, find out what can change the ranking.
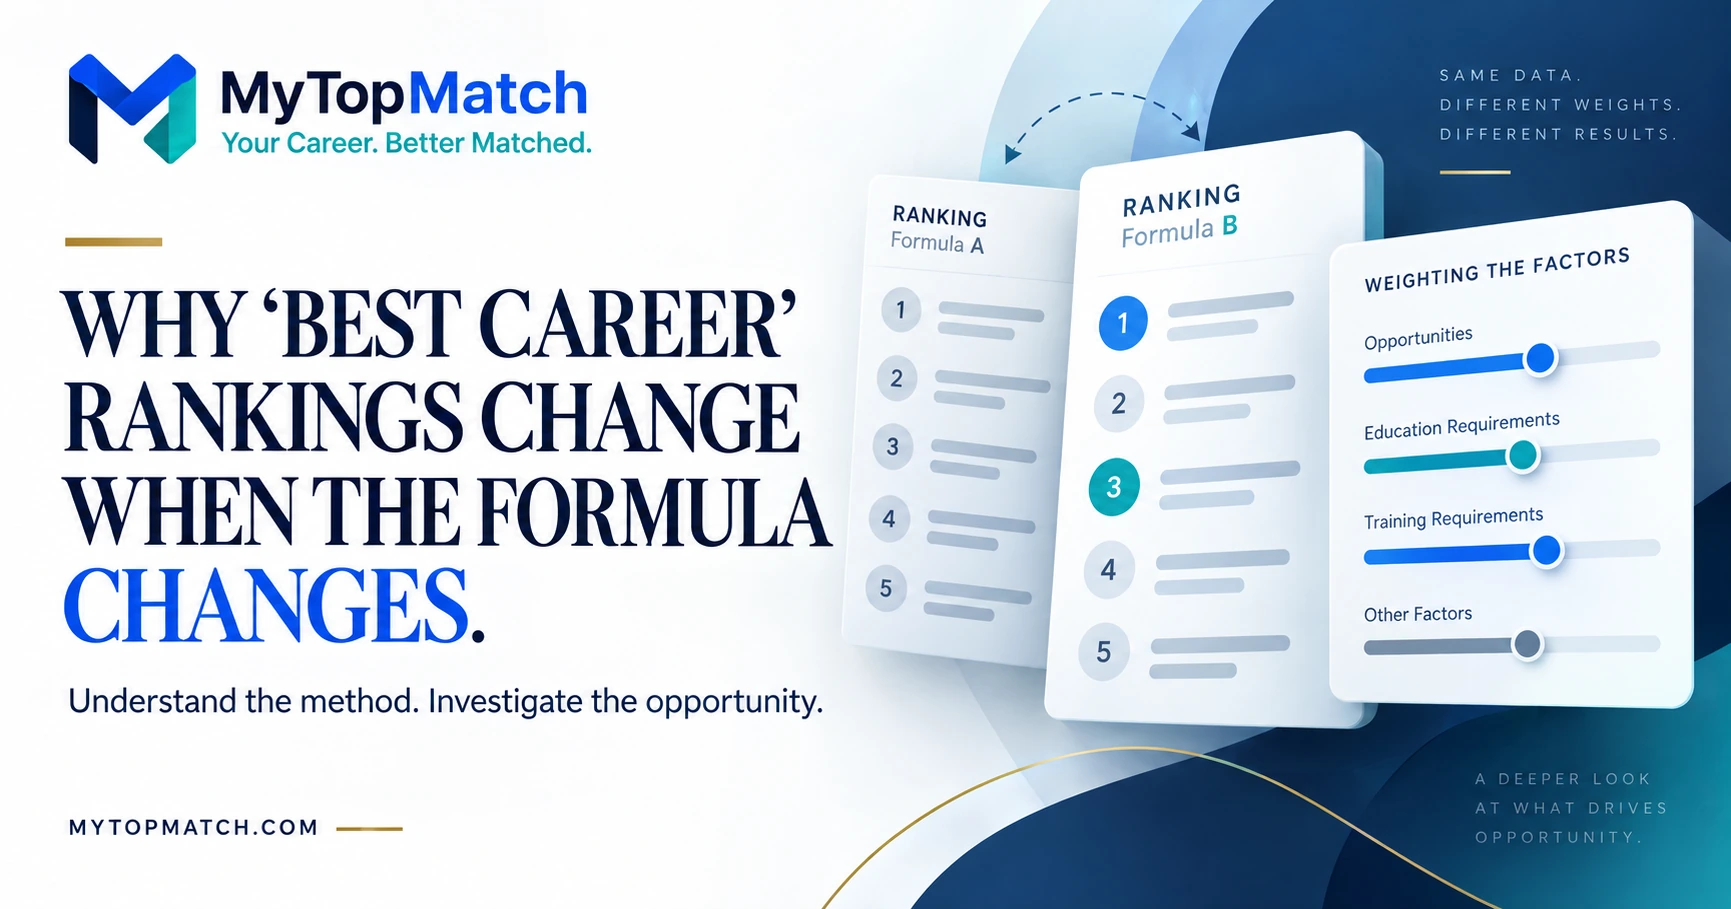
A job can move up a list because the evidence improved. It can also move because the formula gives more weight to pay, treats preparation differently, or removes an input. Those are different reasons to reconsider a career.
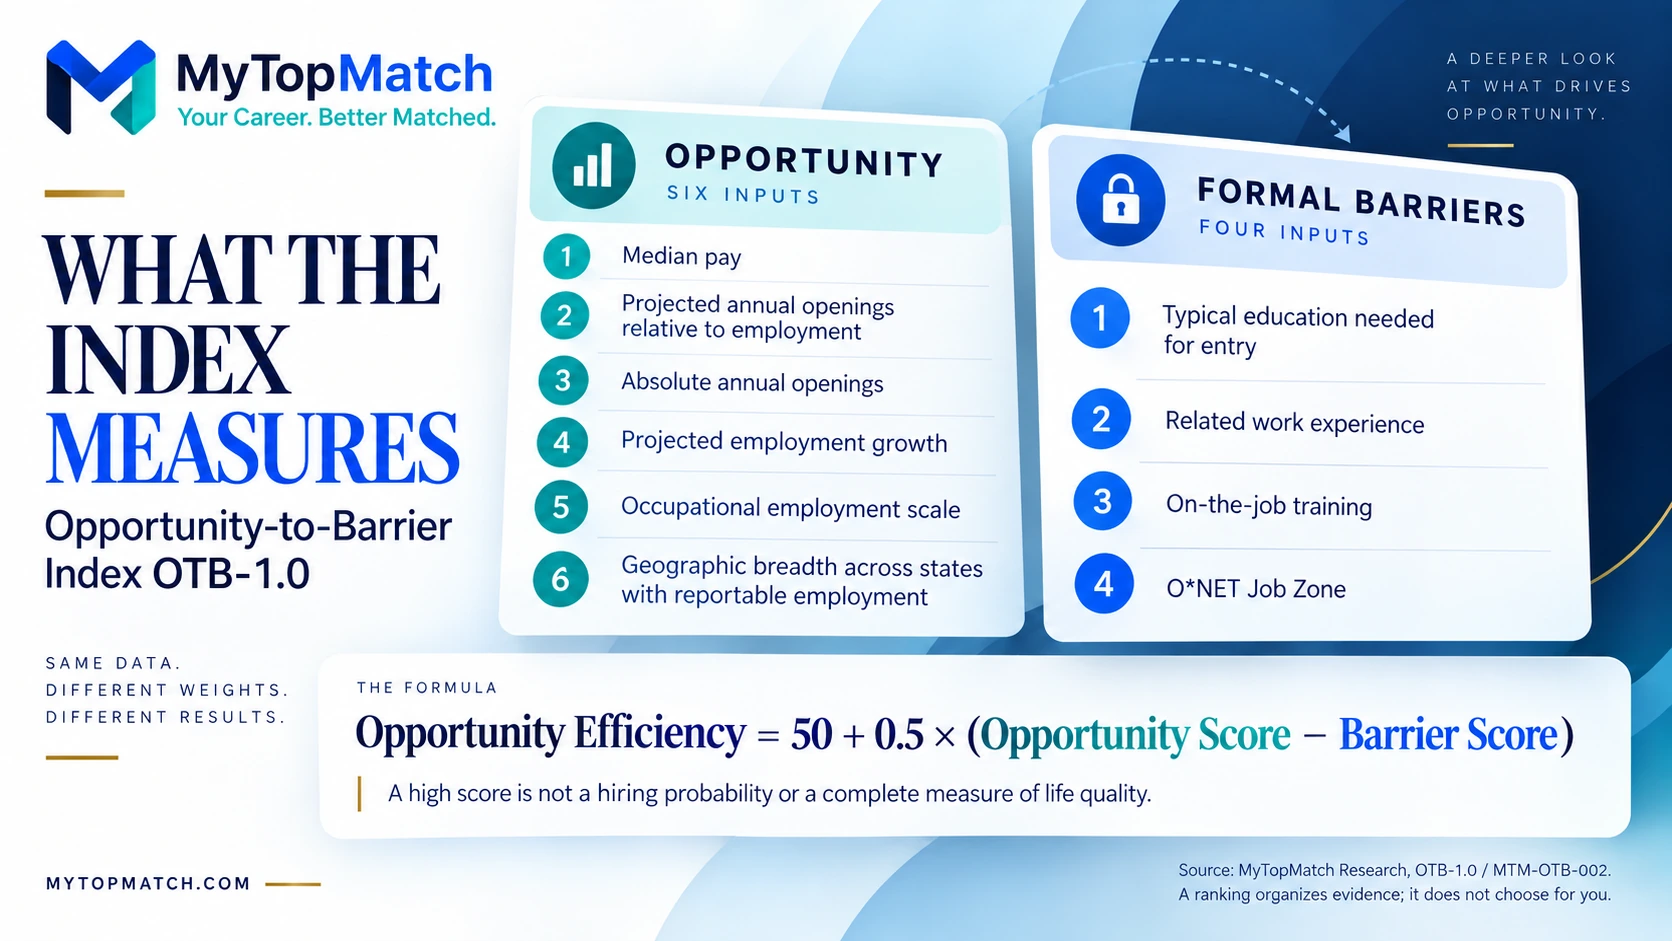
MyTopMatch tested that distinction on its own Opportunity-to-Barrier Index. Across 747 occupations and 2,000 variations in component weights, the median width of the occupation-specific rank intervals was 69 positions. The underlying inputs stayed fixed during those weight tests. The formula changed how much they counted. [S1]
That finding does not make a career ranking useless. It creates a responsibility to explain what the ranking measures and how firmly an occupation holds its place.
A numbered list can organize your investigation. It cannot supply your priorities or make the decision for you.
What MyTopMatch put to the test
The analysis examined a national index of opportunity relative to measured formal preparation. Its sources were BLS Employment Projections for 2025–2035, May 2025 Occupational Employment and Wage Statistics, and O*NET 31.0. Of 831 detailed line-item occupations in the starting projections file, 747 had complete values for all ten required components. Missing inputs were not filled in to make other occupations eligible. [S1]
The study tested changes to component weights, removed components one at a time, and examined alternative scoring and geographic specifications. [S1]
| Reported finding | What it means |
|---|---|
| 69 positions | Median width of the occupation-specific 5th-to-95th-percentile rank intervals across 2,000 weight simulations. |
| 71.6% of occupations | Had a rank interval at least 50 positions wide under those weight variations. |
| 15.3% of occupations | Had a rank interval at least 100 positions wide. This group is also included in the 50-or-more group. |
| 48 of 75 occupations retained | Remained in the top decile, the leading 75 occupations, after the openings-rate component was removed. |
Source: MyTopMatch Research, finding MTM-OTB-002. Rank intervals summarize sensitivity to specified modeling choices. They are not confidence intervals for survey sampling error or estimates of anyone’s hiring prospects. [S1]
The important lesson is the difference between a precise calculation and a conclusion that remains stable when reasonable assumptions change.
First, ask what “best” is supposed to mean
This index has a defined purpose: compare measured opportunity with measured formal barriers. It does not claim to measure every dimension of a good career. [S1]
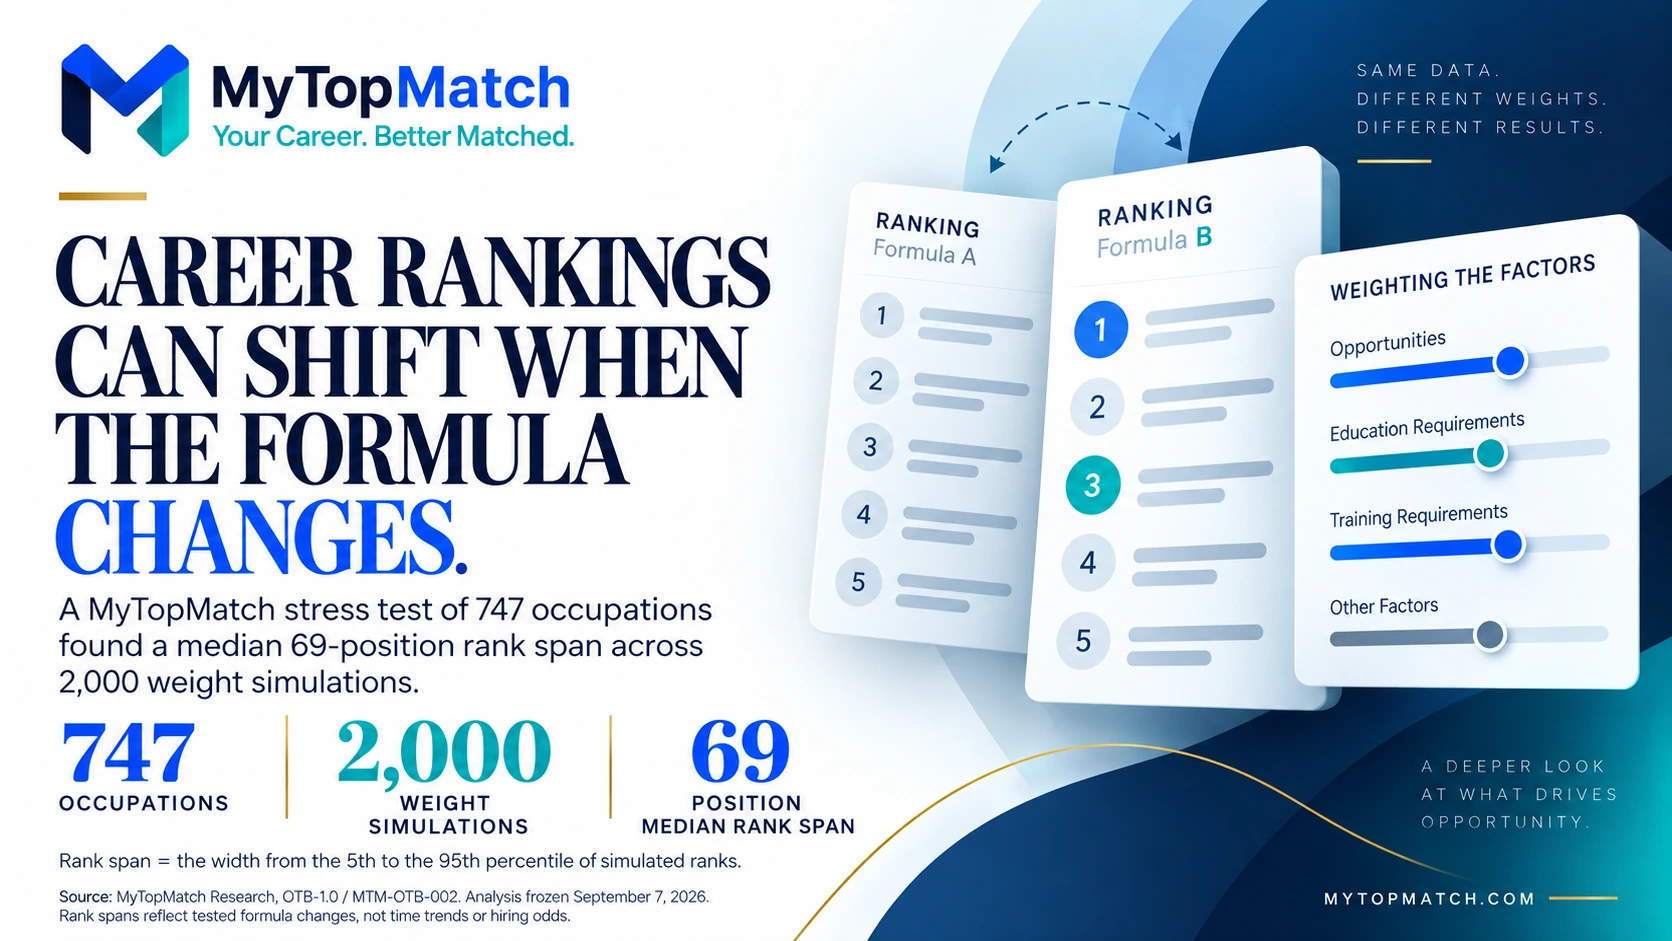
Its Opportunity pillar includes median pay, projected openings relative to employment, the number of annual openings, projected employment growth, employment scale, and geographic breadth across states with reportable employment. Its Barrier pillar includes BLS typical-entry education, related work experience, on-the-job training, and O*NET Job Zone preparation. [S1]
The primary calculation is:
Opportunity Efficiency = 50 + 0.5 × (Opportunity Score − Barrier Score).
Components are converted to comparable 0–100 scales, then weighted equally within each pillar. A higher result means stronger measured opportunity relative to the preparation measures included. It does not mean a higher percentage chance of being hired or satisfied. [S1]
The source definitions matter. BLS projected occupational openings combine employment change with openings associated with people leaving the labor force or moving into different occupations. They do not count every employer-to-employer move within an occupation, and they are not current job advertisements. [S3]
Likewise, BLS’s education category describes typical preparation for entry. Its training category concerns preparation needed to attain competency. Neither is a complete description of every employer’s requirements. O*NET Job Zones also group occupations by education, experience, and training. [S4][S5]
An index emphasizing those measures asks a different question from a ranking emphasizing schedule control, benefits, or a particular worker’s interests.
Before using any “best career” list, try finishing this sentence:
This list ranks these occupations by ______, using evidence from ______, for the purpose of ______.
An unclear answer is a reason to investigate the method before acting on the result.
What a 69-position interval actually means
For each simulation, the study multiplied each component’s starting weight by a randomly selected value between 0.75 and 1.25, then rescaled the weights to sum to one within their respective pillars. The two pillar structures and the underlying component scores remained in place. [S1]
Each occupation therefore received 2,000 simulated ranks. The reported interval runs from its 5th-percentile rank to its 95th-percentile rank. The width is the difference between those endpoints. The median of those widths across the 747 occupations was 69. [S1]
That does not mean every occupation moved 69 places. It is not the average movement from the original rank, the full minimum-to-maximum range, or a change observed over 2,000 points in time.
The middle of the table was particularly sensitive. Occupations in the fifth and sixth primary-rank deciles had a median interval width of 94 positions. The source also notes a mechanical limitation: an occupation already ranked first cannot move higher, and one ranked last cannot move lower. Some narrower intervals at the extremes reflect those boundaries. [S1]
For a reader comparing adjacent positions, the implication is practical: investigate what distinguishes the occupations before treating a one-place advantage as meaningful.
The weight tests also have a boundary of their own. Their range is a documented research choice, not a survey of public preferences. Very different weights could produce results outside the range tested. [S1]
A similar-looking list can have a different leading group
One of the study’s strongest findings concerns a measure that can sound reassuring: correlation.
After the openings-rate component was removed, the new ranking still had a Spearman rank correlation of 0.954 with the original. That coefficient describes similarity in ordering across the full list. It is not “95.4% accuracy.” [S1]
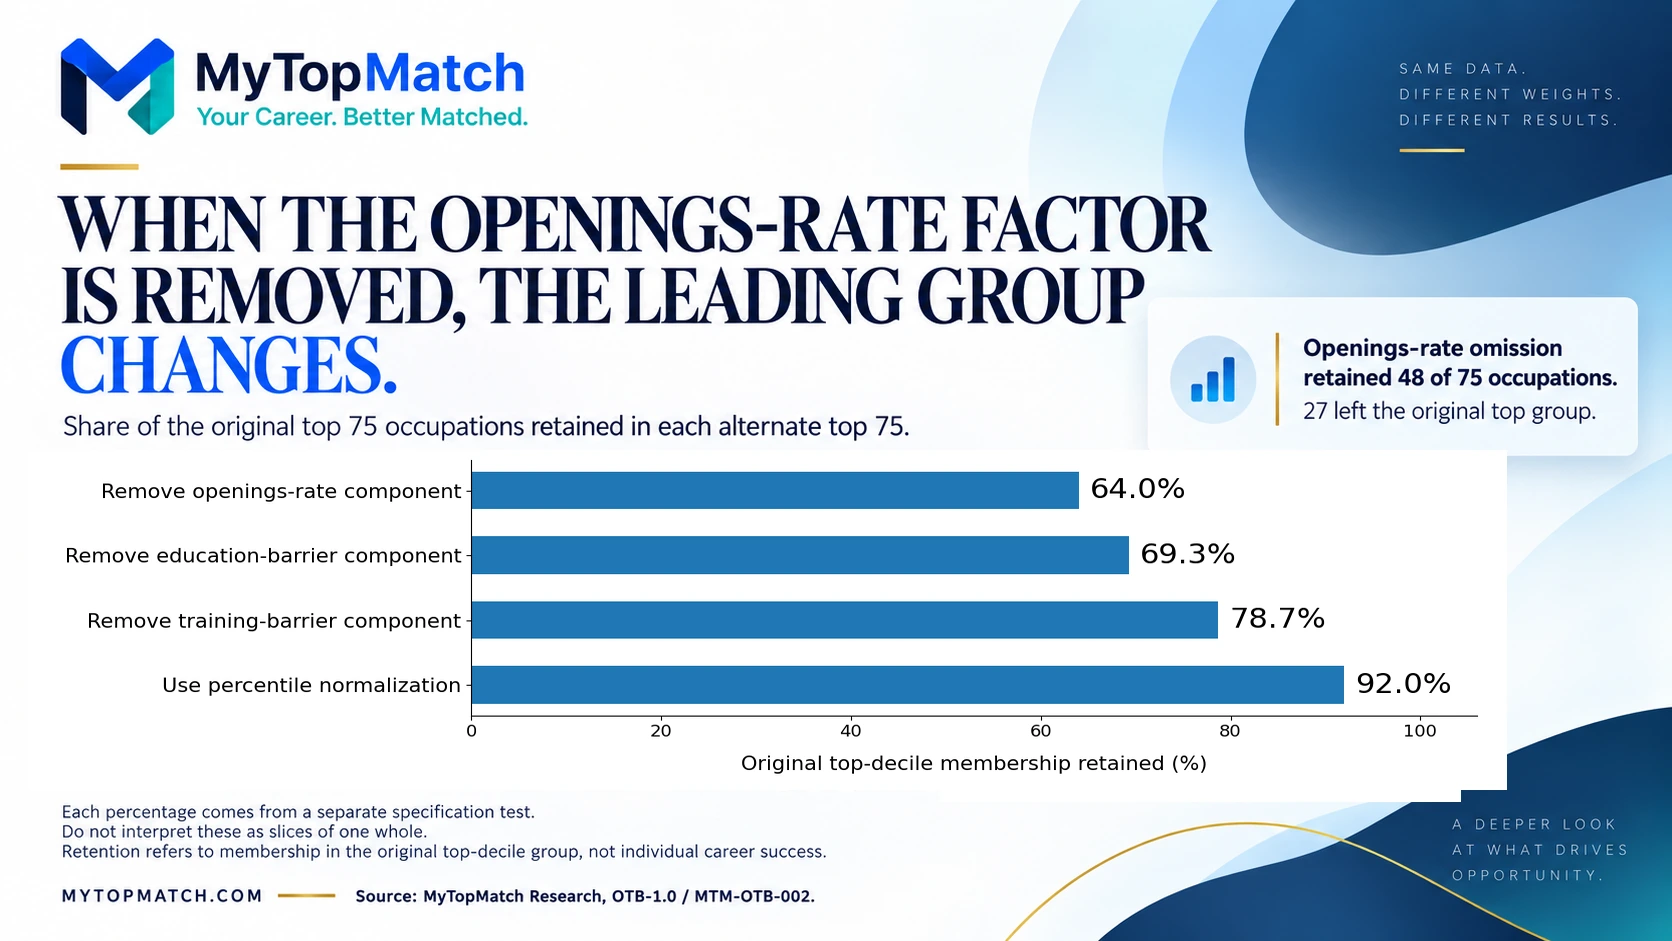
Yet only 48 of the original top 75 occupations remained in the alternate top 75. Twenty-seven left that group, producing a retention rate of 64%. [S1]
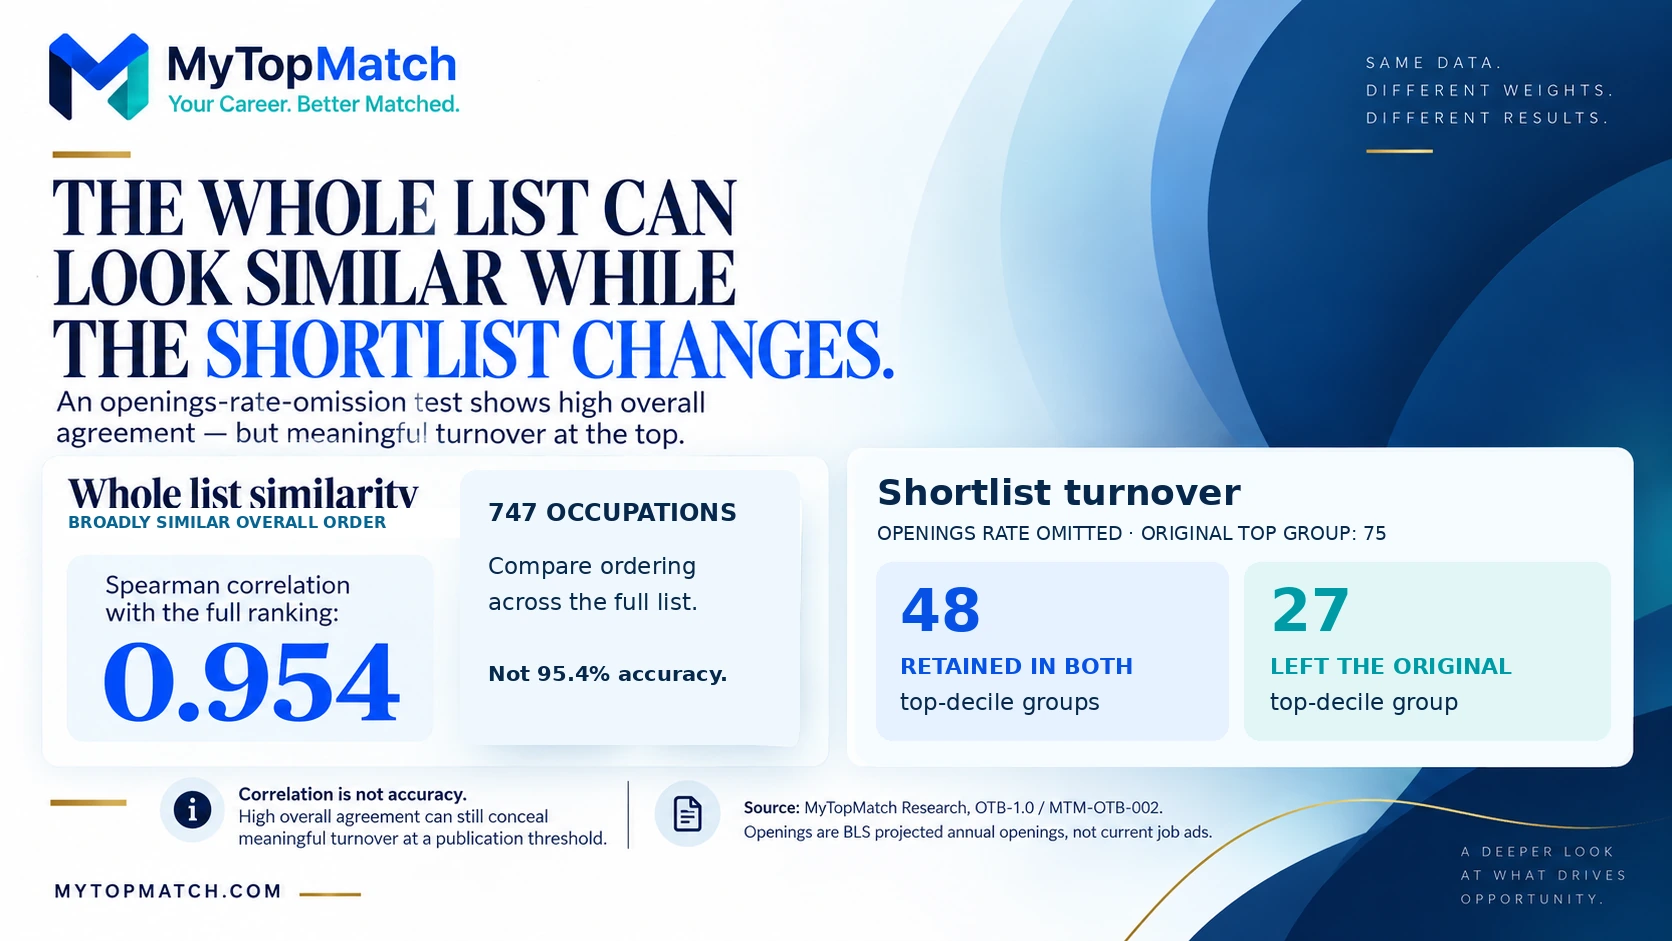
If you were using the top group to decide what to investigate, those membership changes would matter even though the overall list still looked broadly similar.
Other specifications produced different patterns:
| Selected change to the index | Whole-ranking Spearman correlation | Original top-decile membership retained |
|---|---|---|
| Remove openings rate | 0.954 | 64.0% |
| Remove the training-barrier component | 0.892 | 78.7% |
| Replace the primary normalization with percentile ranks | 0.993 | 92.0% |
Each row is a separate specification test against the primary ranking. Retention uses the same original group of 75 occupations; it is not a hiring-success rate. [S1]
The lowest whole-list correlation and the lowest top-group retention occurred in different tests. That is why a publisher should examine both the full ordering and the actual shortlist readers are likely to use.
Normalization is the step that places unlike inputs, such as wages and preparation categories, on comparable scales. The primary method used robustly standardized scores and a cumulative-distribution transformation; the alternative used percentile ranks. [S1]
Changing an input’s weight, removing it, and changing its scale are distinct tests. Passing one does not settle all the others.
Even a stable first place has a limited meaning
Stockers and order fillers led the primary Opportunity-to-Barrier ranking. Their 5th- and 95th-percentile simulated ranks were both first, and their ranks ranged from first to fourth across component-omission tests. [S1]
That is a strong result within this index. The occupation’s position reflected employment scale, openings, geographic breadth, and low measured formal preparation barriers. Its pay component was comparatively weak. [S1]
The result does not establish that stocking is easy, universally accessible, or the best occupation for a particular person. The index does not evaluate benefits, schedules, physical demands, injury risk, employer quality, or individual preferences. [S1]
Stability answers how much the result changes under a test. Suitability asks whether the work makes sense for you.
A stable leader deserves a clear explanation of why it leads. It should still be evaluated against the conditions and responsibilities of an actual opportunity.
A small example: the inputs stay fixed and the winner changes
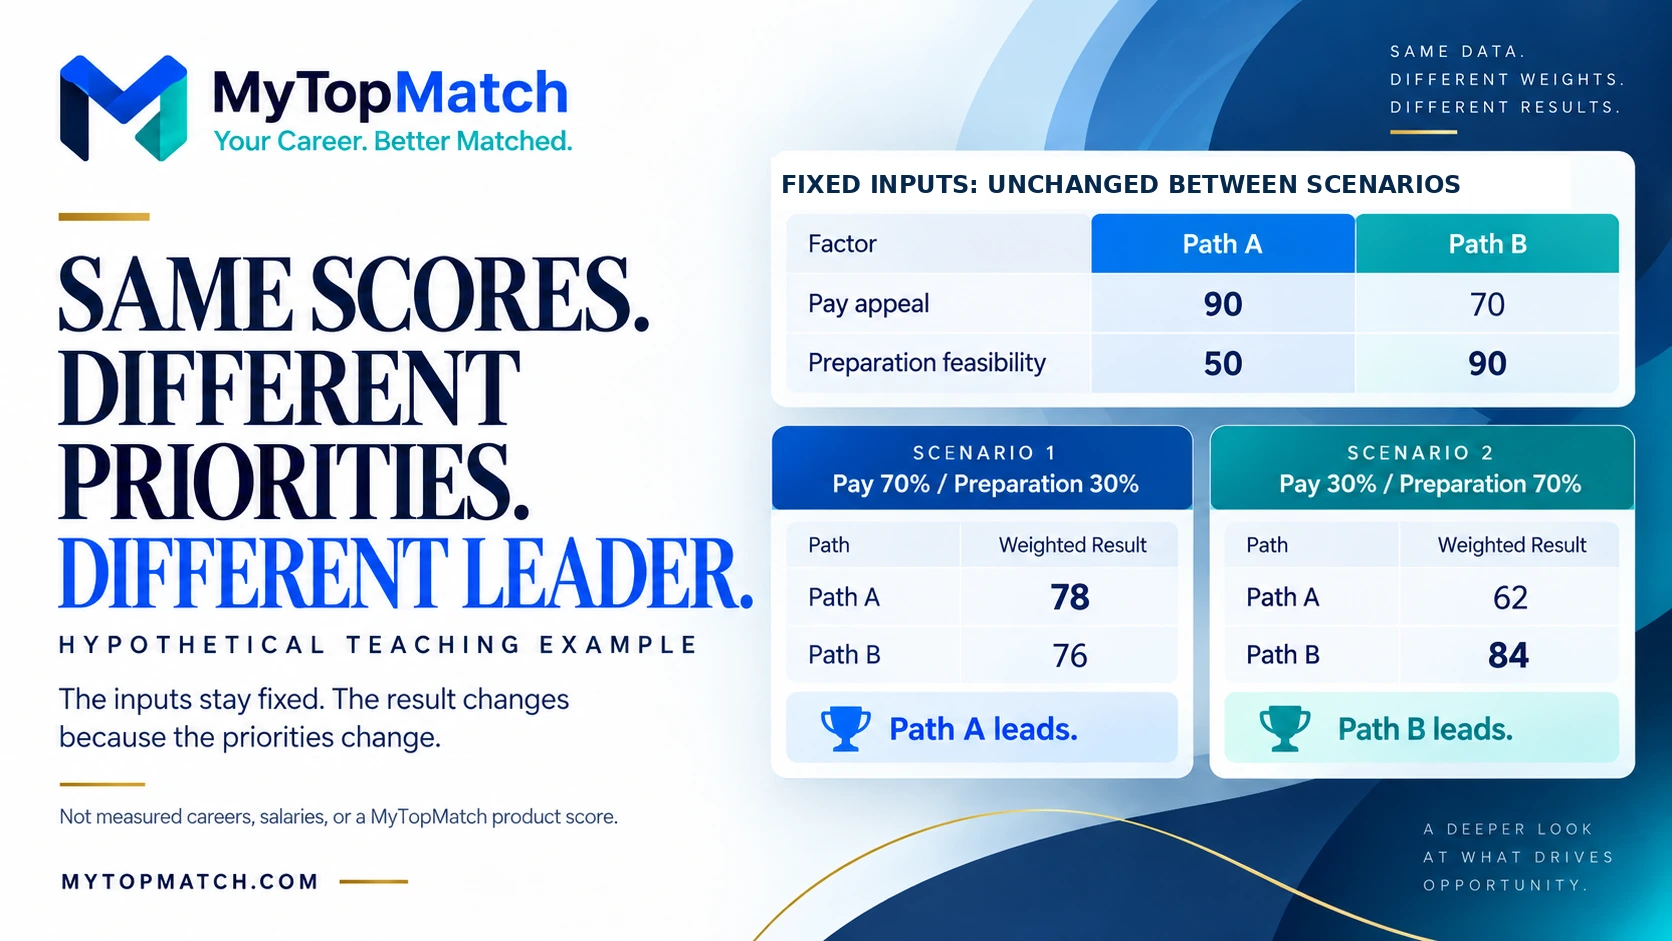
This is a fictional arithmetic example, separate from MyTopMatch’s research model. Path A and Path B are invented options. Their 0–100 scores are assumed teaching values, not measured careers, salaries, assessments, or platform results.
Suppose a simple comparison uses two factors. Higher “pay appeal” is better, and higher “preparation feasibility” means the preparation is more manageable under the example’s assumptions.
| Fictional option | Pay appeal | Preparation feasibility |
|---|---|---|
| Path A | 90 | 50 |
| Path B | 70 | 90 |
Give pay 70% of the weight and preparation feasibility 30%:
Path A: (90 × 0.70) + (50 × 0.30) = 78. Path B: (70 × 0.70) + (90 × 0.30) = 76.
Path A leads.
Reverse those weights, giving pay 30% and preparation feasibility 70%:
Path A: (90 × 0.30) + (50 × 0.70) = 62. Path B: (70 × 0.30) + (90 × 0.70) = 84.
Path B leads. No underlying score changed.
Both calculations follow their stated rules. The difference comes from what the rule values. The example does not tell you which weights to choose, and its wider weight shift is not the study’s plus-or-minus-25% test.
For a real comparison, explain what an improvement on each scale means before assigning weights. A neat total cannot make poorly defined inputs useful.
Your nonnegotiables need a place outside the average
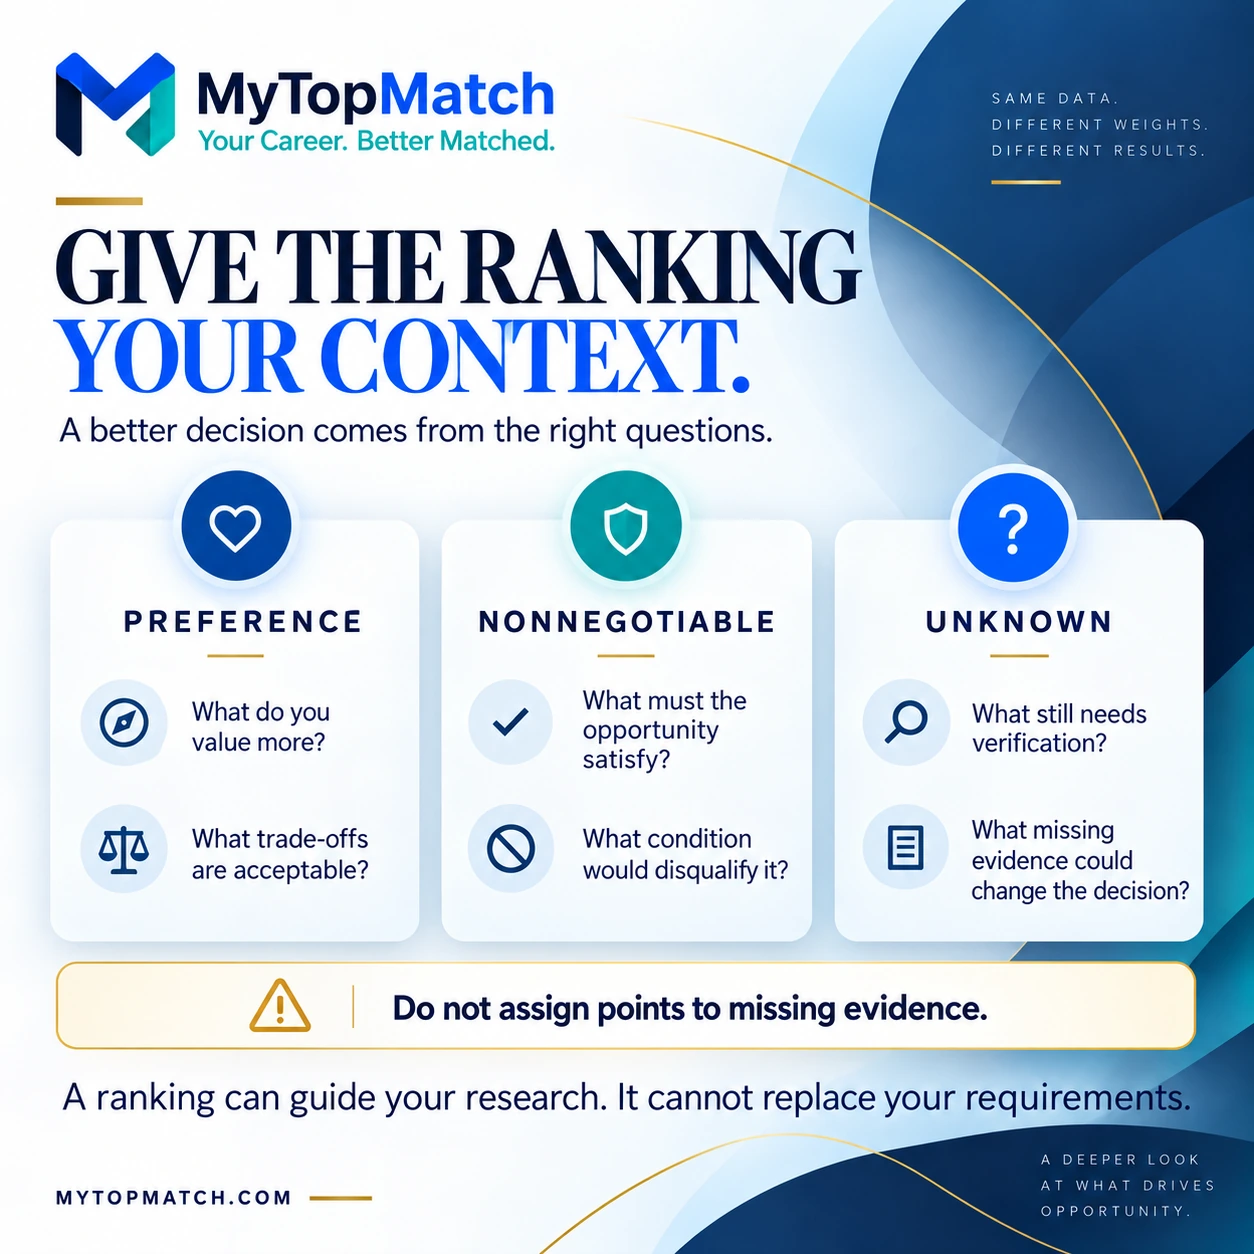
Here is a practical distinction I recommend making before comparing scores: separate what you prefer from what an opportunity must satisfy. This is original decision guidance, not a tested feature of the research index.
A preference may permit a trade-off. You might accept a longer commute for responsibilities you value more. A genuine constraint needs a different treatment. A role with required hours you cannot work does not become workable because its salary adds enough points to an average.
That does not require dismissing an entire occupation. Check whether the particular employer and arrangement can meet the condition. A national occupational score cannot answer a vacancy-specific question.
Missing evidence belongs in a separate category too. Unconfirmed remote eligibility is an unanswered question. An unverified qualification route remains unverified. Do not convert a blank into a favorable score just to finish the comparison.
The source index itself excludes comprehensive licensing requirements, remote-work access, schedules, and several other job-quality dimensions. Adjusting weights among its existing components cannot add those missing facts. [S1]
Build a shortlist you can investigate
Use a ranking to identify promising questions, then move toward evidence about real work. The following process is a proposed decision aid; it has not been validated as a predictor of career outcomes.
Define the decision first. Are you choosing a training direction, exploring an adjacent occupation, comparing local opportunities, or evaluating a specific offer? The evidence needed for one decision may be insufficient for another.
Keep the components beside the rank. Record why an option looks attractive and what the index leaves unanswered. Compare a small set of plausible alternatives rather than assuming the first entry deserves all your attention.
Investigate the route from your starting point. Examine employer requirements, your existing capabilities, and the preparation you would still need. An attractive occupation does not, by itself, establish that you can enter it from your current role. That limitation is explicit in the source report. [S1]
Identify what could change your conclusion. Perhaps the decisive question is whether a credential is required, whether relevant openings exist locally, or whether the work arrangement fits. Seek evidence for that question before spending heavily on a course or making a major commitment.
A useful output is a short decision record: your leading possibilities, the evidence supporting each, unresolved questions, and the next action needed to resolve them.
What a trustworthy ranking should make visible
For career platforms, employers, and workforce organizations, this research supports a more informative presentation than a single ordered list. The source’s interpretation rules prioritize separate components, sensitivity intervals, and stable tiers when alternative assumptions materially affect ordering. [S1]
The questions I would ask of a published ranking are these:
| Question | What the answer should clarify |
|---|---|
| What is being ranked? | Occupations, employers, places, or actual jobs; the included universe and exclusions. |
| What does the score reward? | The inputs, direction of each measure, weights, and treatment of missing information. |
| What changes under another reasonable method? | Rank ranges, membership in the promoted group, and the specific alternatives tested. |
| What remains outside the score? | Important requirements, working conditions, personal constraints, and unmeasured outcomes. |
| How current is the evidence? | Reference years, projection horizons, method versions, and any revisions. |
These are proposed review questions, not a claim that every MyTopMatch interface currently displays all five answers.
There is a legitimate role for tiers. BLS itself explains that projected annual openings are ten-year averages, not precise targets for a particular year, and describes rankings or decile groups as useful ways to communicate their relative scale. [S6]
The strongest transparency is specific. Tell the reader which conclusion held, which changed, and what was never tested.
Put your own evidence back into the decision
MyTopMatch’s public Professional Passport page describes organizing skills, achievements, qualifications, career goals, work preferences, and dealbreakers. Those categories can help frame the personal questions a national occupational ranking leaves unanswered. [S7]
Start with what you can demonstrate and the direction you want to explore. Use the research to broaden your options. Examine the requirements and conditions that would make an opportunity workable.
The aim is a career decision grounded in evidence you understand, with priorities you have chosen deliberately.
Before you follow the ranking, understand what moved it. Before you choose the career, understand what matters to you.
Explore the Professional Passport.

Research and evidence note
This article adapts MyTopMatch Opportunity-to-Barrier Index OTB-1.0, Ranking Sensitivity Note 1.0, finding MTM-OTB-002, frozen September 7, 2026. The original research is numbered Article 08 in its source files; this adaptation is Article 7 in the twenty-piece promotional series. [S1]
The source reports that its original audit reproduced the formula, alternate-rank comparisons, and 2,000 weight simulations from frozen component scores. That audit was not repeated for this adaptation. Reported findings were checked against the complete source report; the illustrative arithmetic and displayed retention calculation were recalculated. [S1]
The public archive lists the underlying research. Direct retrieval of its public article body was unsuccessful during this review, so the complete Library report supplies the numerical detail. Official BLS definitions, O*NET documentation, and the public Passport description were checked September 12, 2026. [S2][S3][S4][S5][S6][S7][S8]
The rank intervals do not propagate every survey error, projection uncertainty, or mapping limitation. The simulation weights are not measured public preferences. The fictional example and decision framework are original additions with UNTESTED career outcomes. The signed-in Passport workflow was not tested. [S1]
This adaptation includes analysis derived from the O*NET 31.0 Database, produced by the U.S. Department of Labor, Employment and Training Administration and licensed under CC BY 4.0. MyTopMatch transformed and combined the source information. USDOL/ETA has not approved, endorsed, or tested those modifications. O*NET® is a trademark of USDOL/ETA. [S8]
Give the ranking your context.
Clarify your skills, goals, work preferences and dealbreakers before narrowing your next move.
Explore the Professional Passport →: https://mytopmatch.com/professional-passport
Public description reviewed; signed-in workflow and outcomes not tested in this article review.