KEY FINDINGS
The finding at a glance
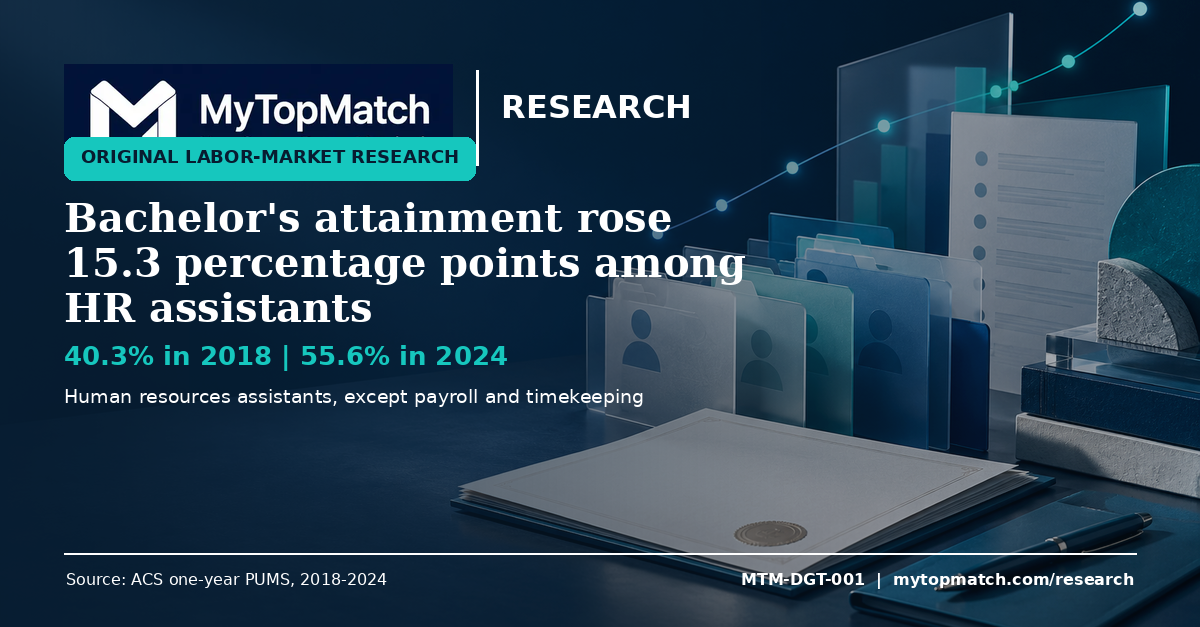
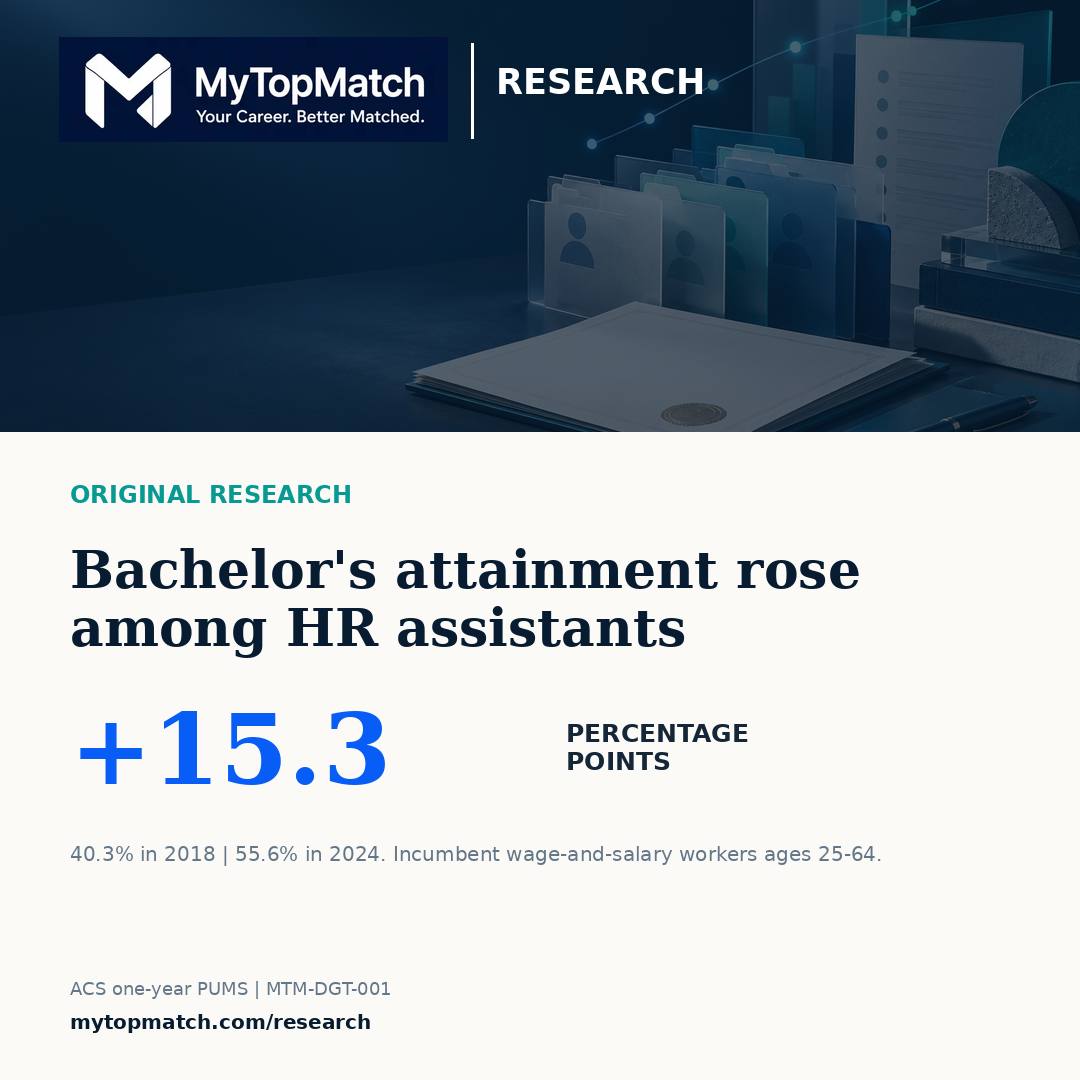
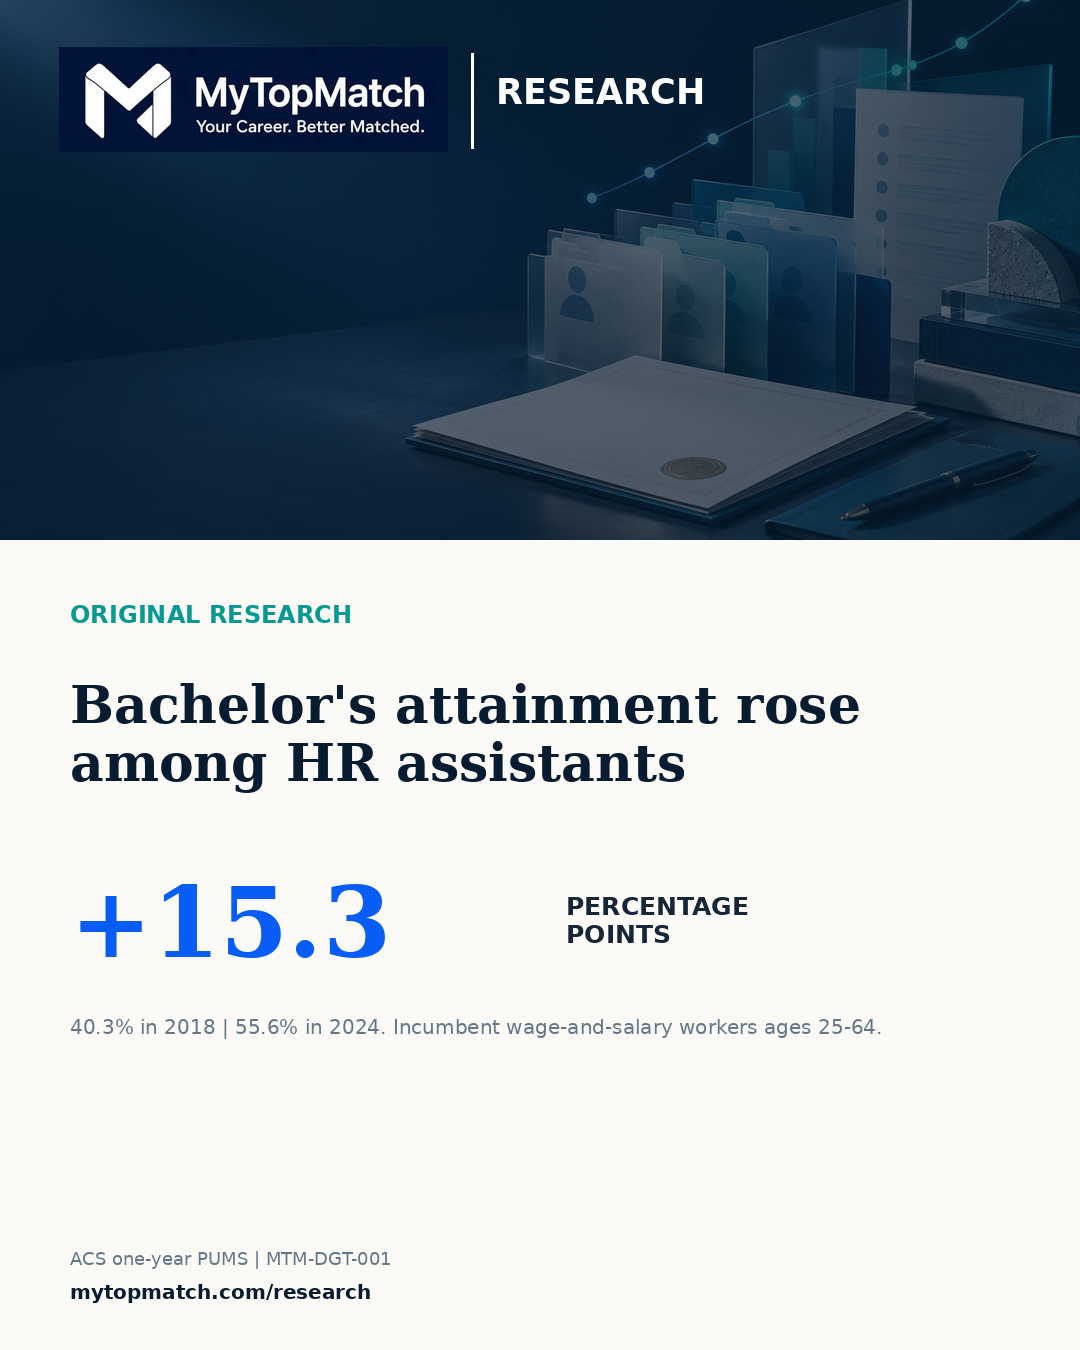
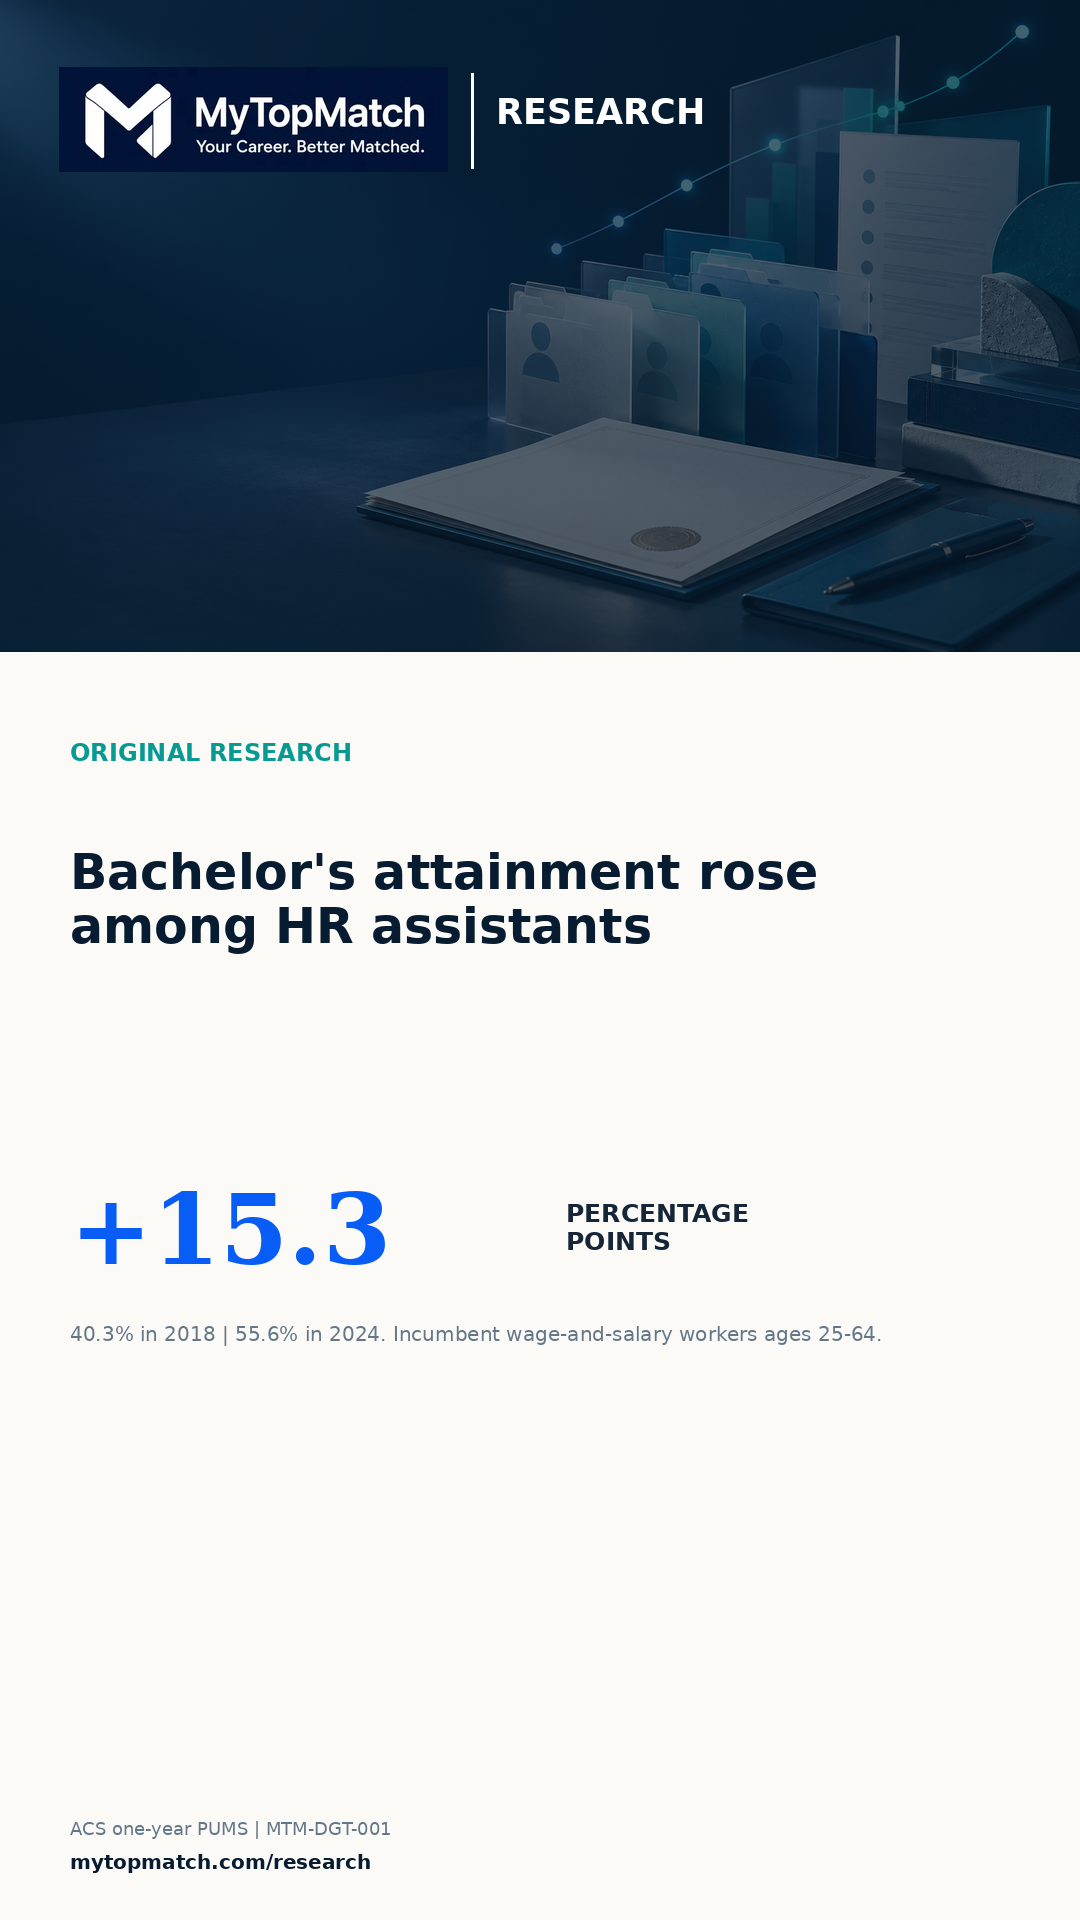
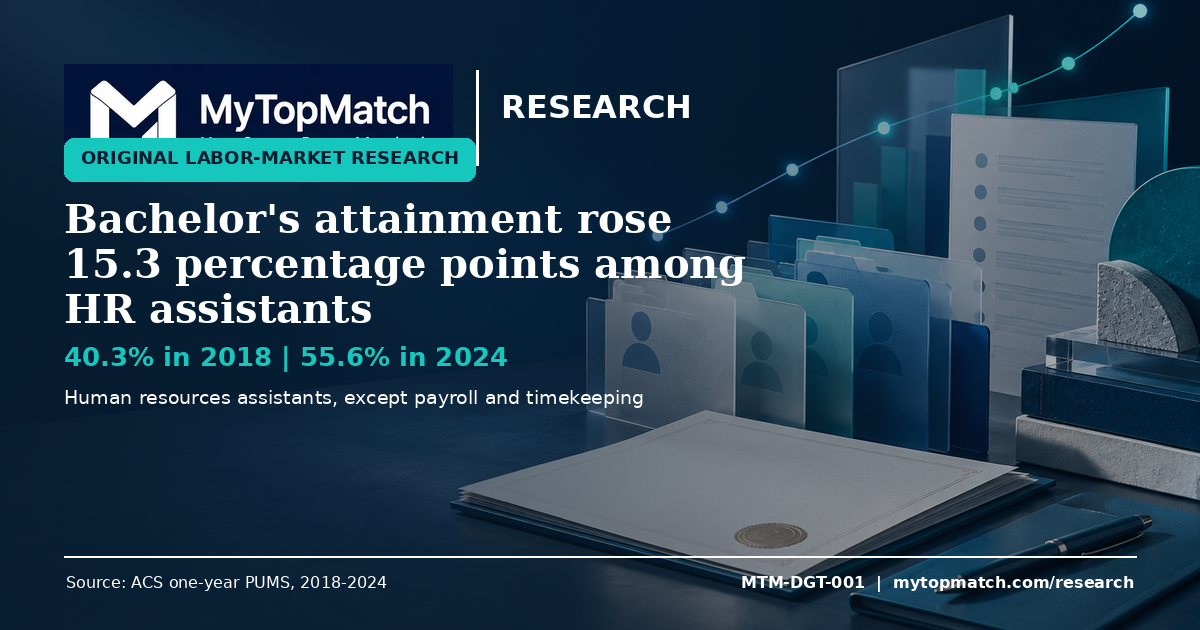
Bachelor's-or-higher attainment increased from 40.3% in 2018 to 55.6% in 2024.
The interval for the endpoint change remained above the prespecified five-point practical threshold.
The change survived multiple-comparison control across eligible occupations.
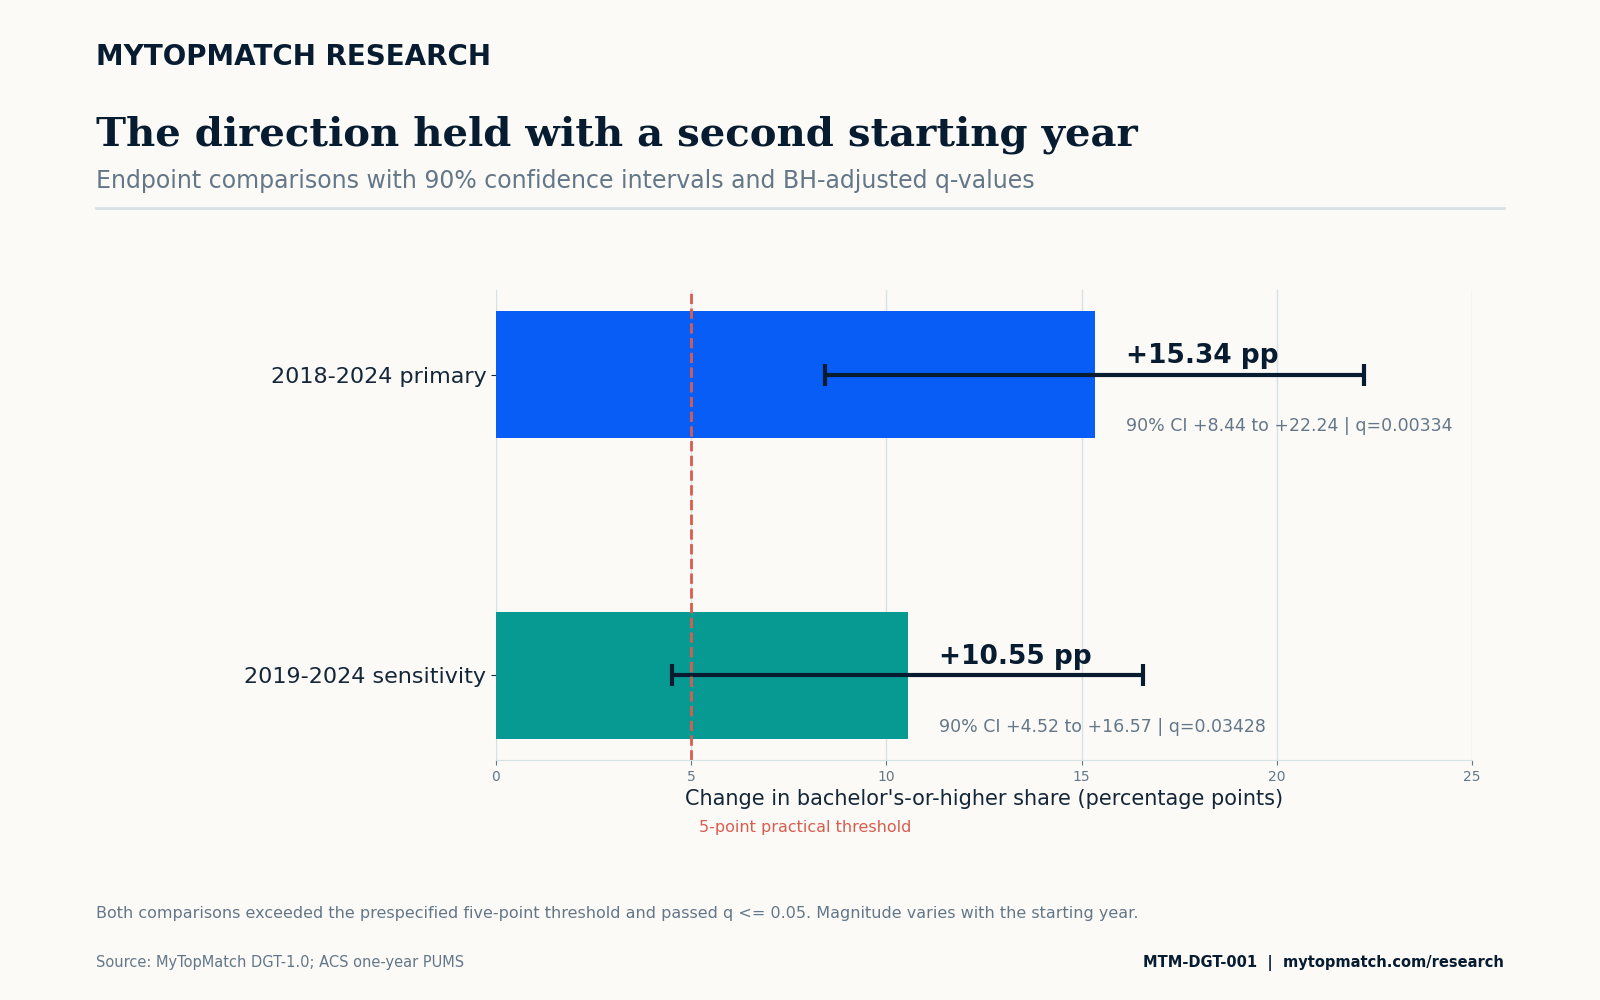
The 2019–2024 comparison also passed the FDR standard, with q=0.0343.
CHARTS AND GRAPHICS
The evidence in view
Each figure identifies the source, methodology record, and finding ID. Downloadable publication and social formats are available below.
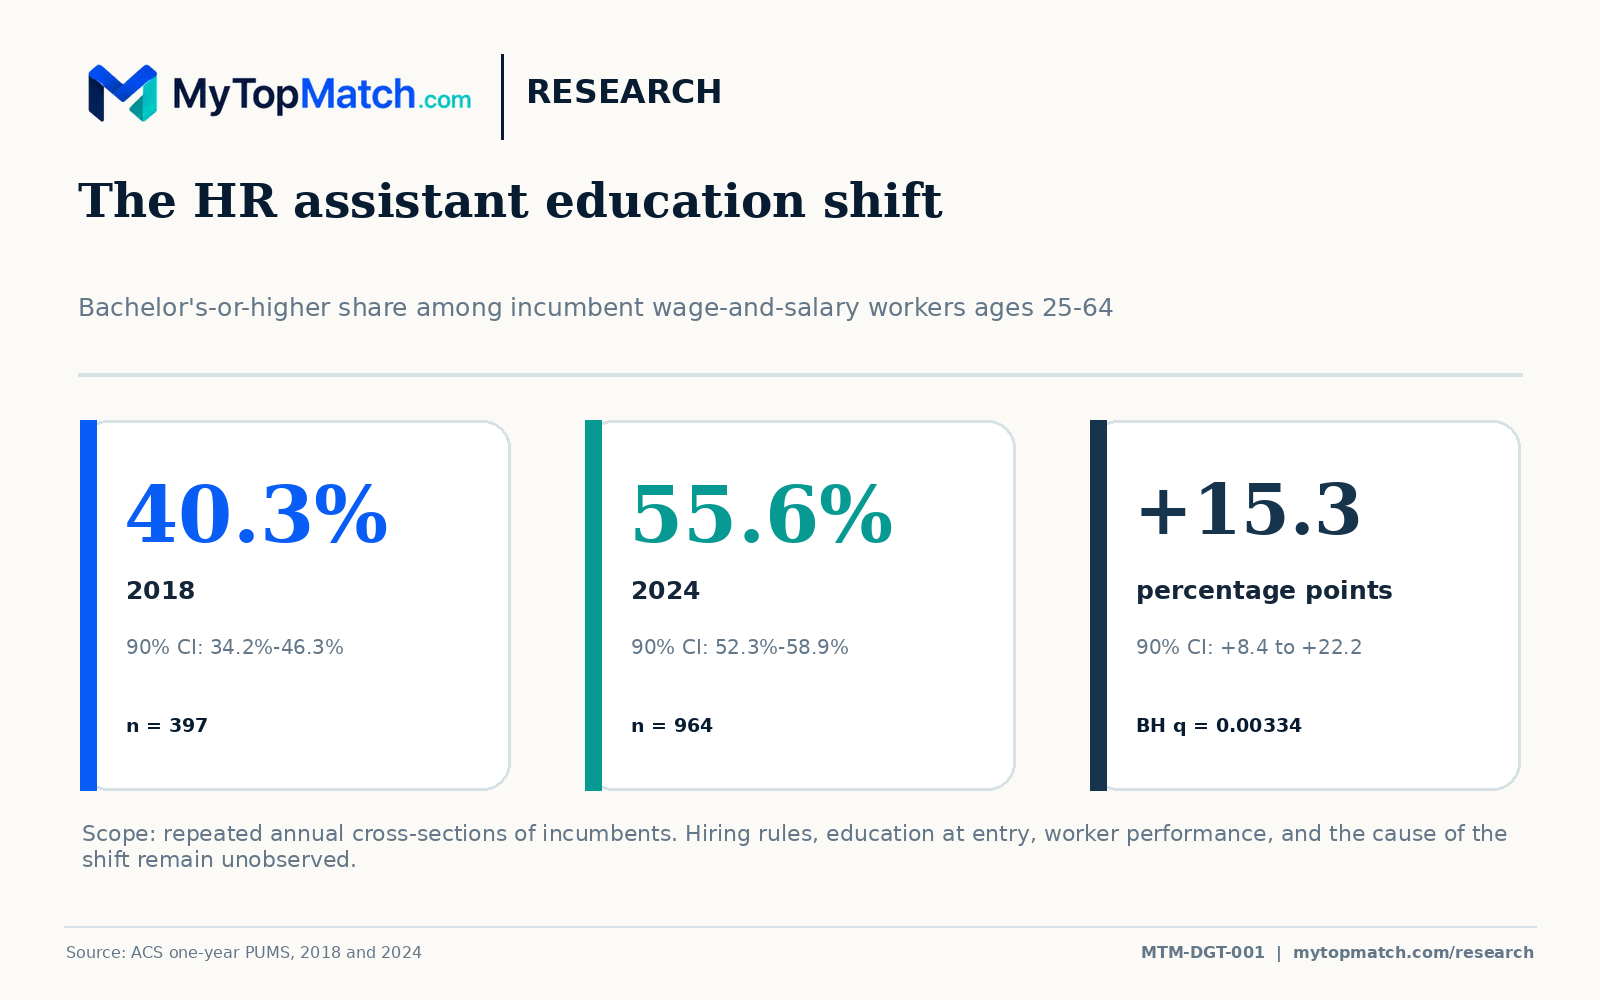
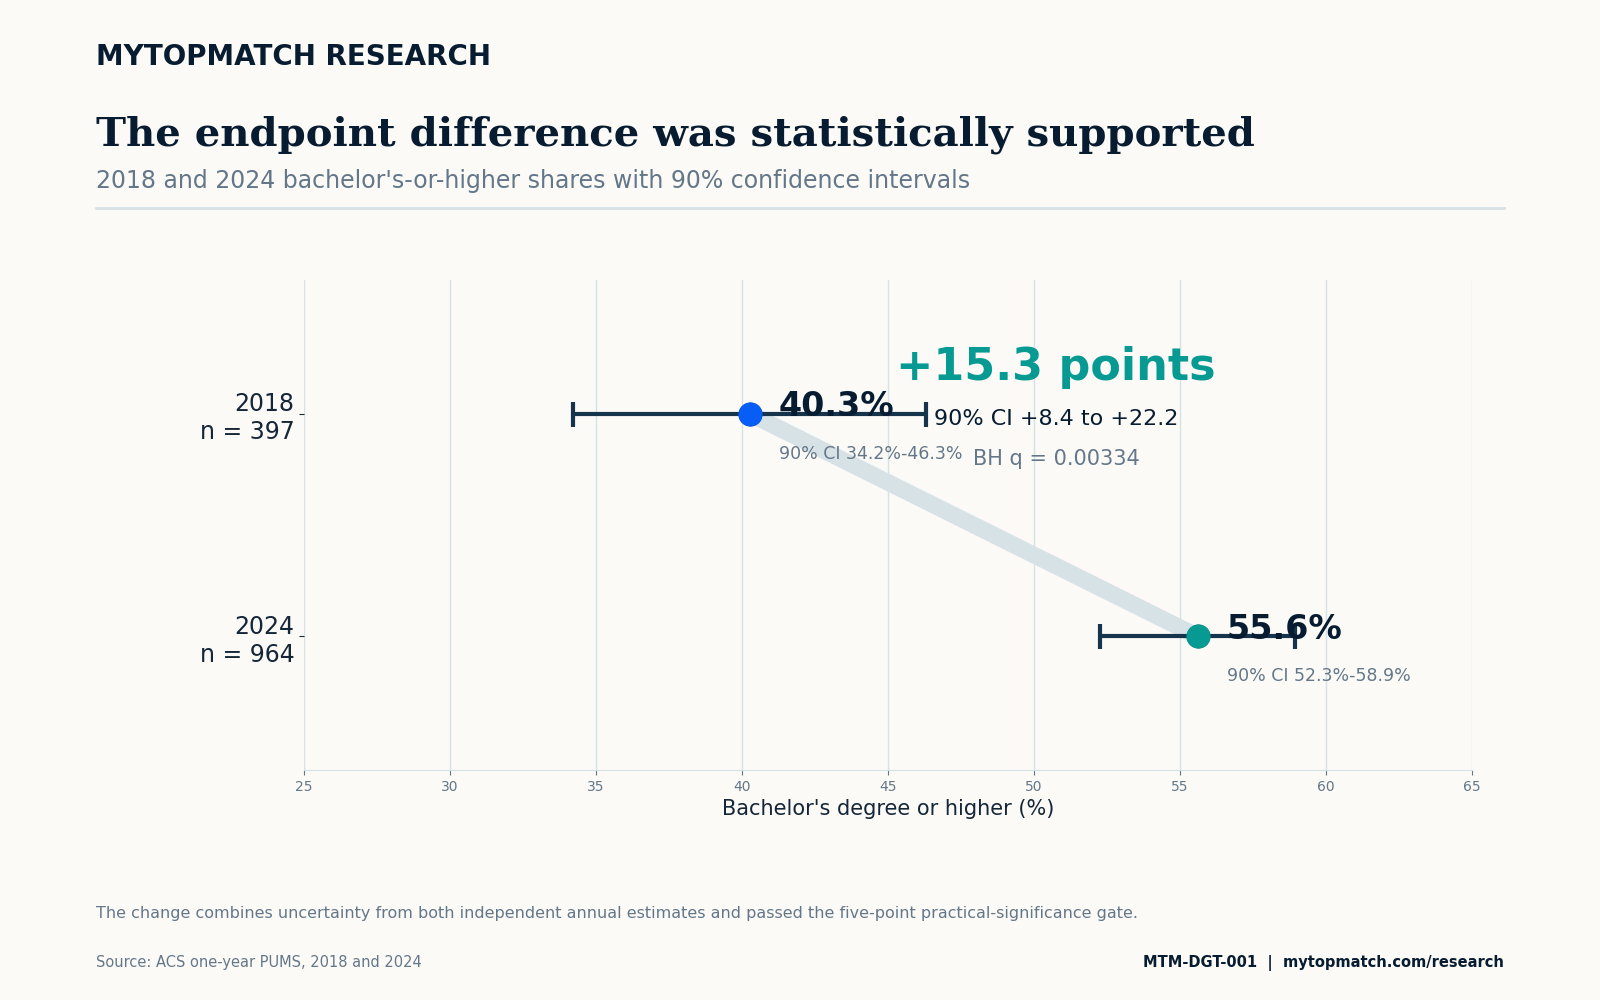
The education profile of human resources assistants changed substantially between 2018 and 2024. A MyTopMatch Research analysis of U.S. Census Bureau microdata estimated that 40.3% of human resources assistants held at least a bachelor's degree in 2018. The share reached 55.6% in 2024—an increase of 15.34 percentage points.
The result passed the study's sample-quality rules, replicate-weight uncertainty calculation, five-point practical-significance threshold, and multiple-comparison correction. The 90% confidence interval for the endpoint change ranged from 8.4 to 22.2 percentage points. The two-sided p-value was 0.000257, and the Benjamini-Hochberg q-value was 0.00334.
This is a finding about incumbent workers. It does not reveal whether employers raised degree screens, whether workers earned degrees before or after entering the occupation, or whether a bachelor's degree is required for a particular vacancy.
The annual series
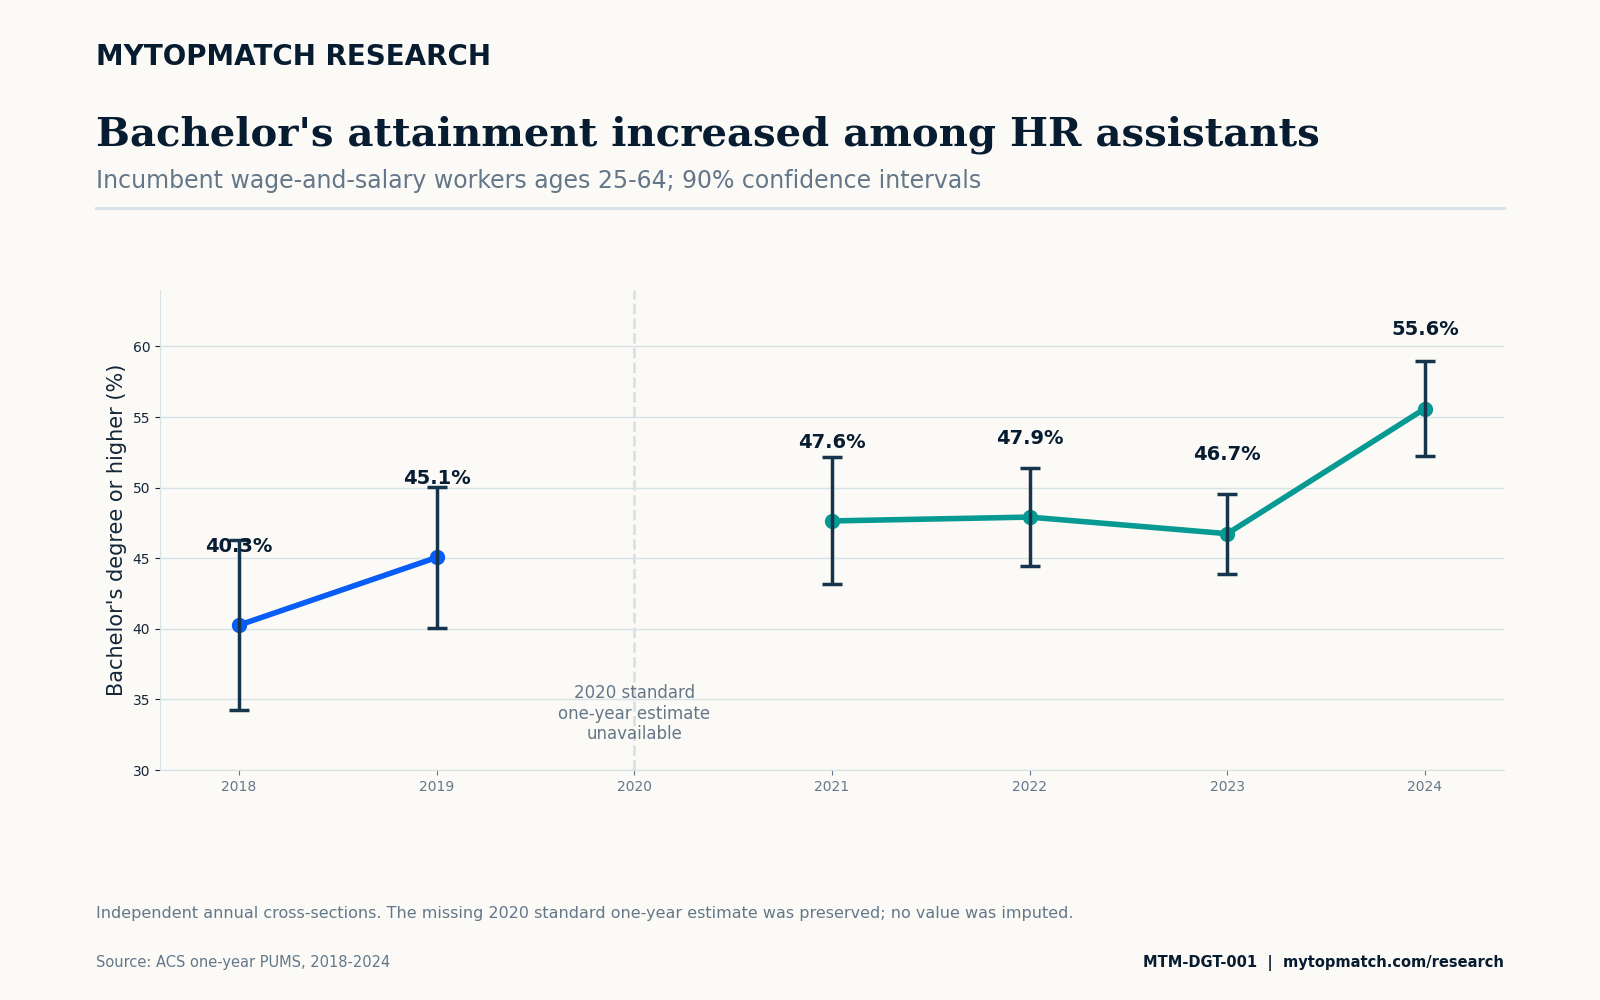
The estimated share was 40.3% in 2018, 45.1% in 2019, 47.6% in 2021, 47.9% in 2022, 46.7% in 2023, and 55.6% in 2024. These are six independent annual cross-sections. They do not follow the same workers through time.
The Census Bureau did not release standard 2020 ACS one-year estimates because pandemic-related data-collection problems prevented the usual statistical-quality standard from being met. MyTopMatch excluded the experimental product, preserved 2020 as missing, and performed no interpolation.
A second starting year supports the direction
Because an endpoint result can be unusually sensitive to the first year selected, MyTopMatch repeated the test using 2019 as the starting point. The bachelor's-or-higher share rose from 45.1% in 2019 to 55.6% in 2024. The 10.55-point increase also passed the practical threshold and produced a Benjamini-Hochberg q-value of 0.0343.
The sensitivity test supports the direction and practical importance of the main finding while showing that the exact magnitude depends partly on the starting year. The approved headline remains tied to the prespecified 2018-to-2024 comparison.
The median education category also moved
MyTopMatch collapsed ACS attainment into seven ordered categories. The weighted median category for human resources assistants was an associate degree in 2018 and a bachelor's degree in 2024. This is a separate derived description of the same changing distribution.
BLS lists an associate degree as the typical education needed for entry. It reports 96,500 jobs in 2025, a $50,610 median annual wage, 7,900 projected annual openings over 2025–35, and a projected employment decline of 6.2%. Those values describe an occupation-level entry category and outlook; they do not convert the observed ACS education distribution into an employer requirement.
What human resources assistants do
The 2018 Standard Occupational Classification defines human resources assistants, except payroll and timekeeping, as workers who compile and maintain personnel records, record employee information, prepare employment-record reports, and retrieve authorized information. The analysis does not combine them with human resources specialists, HR managers, payroll clerks, or timekeeping clerks.
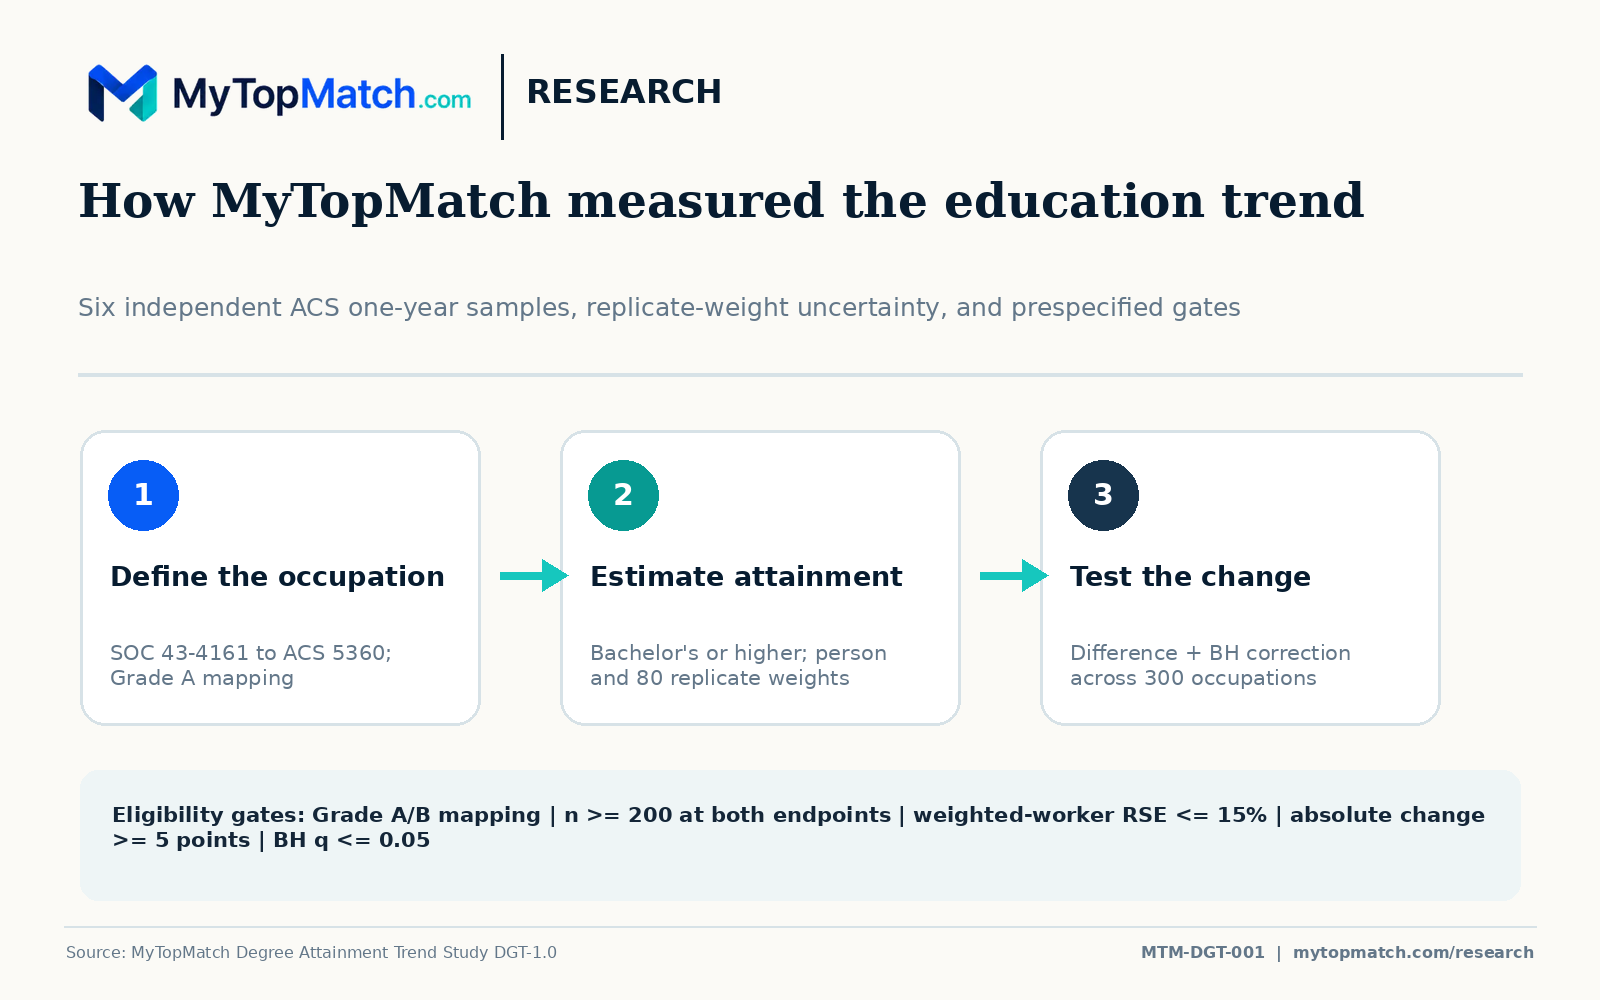
The official BLS National Employment Matrix-to-ACS crosswalk maps SOC 43-4161 to ACS occupation code 5360 on a one-to-one basis. MyTopMatch classified that alignment as Grade A. The endpoint samples included 397 observations in 2018 and 964 in 2024.
The finding is broader than a single-year fluctuation
The statistical test addresses the full difference between independent 2018 and 2024 estimates and incorporates uncertainty in both years. The difference standard error was 4.20 percentage points, and the lower bound of the 90% interval remained above the five-point practical threshold.
MyTopMatch tested 300 occupations that passed both endpoint quality gates in the bachelor's-attainment outcome family. Twenty-one recorded increases of at least five percentage points and passed the false-discovery-rate standard. Human resources assistants were one of those 21.
What could have produced the change
Several mechanisms remain plausible: employers may have hired a larger share of degree holders; workers with different educational backgrounds may have exited at different rates; incumbents may have completed degrees after entry; or the occupation's industry, geography, or coding mix may have changed. The ACS analysis does not isolate these mechanisms.
A claim of employer-driven credential inflation would require consistent job-posting histories, employer policy records, applicant-tracking data, or another design that observes changing screening rules. This study reports a workforce-composition change.
What this means for job seekers
People considering HR assistant work should expect to encounter a workforce with more bachelor's-degree holders than the occupation had in 2018. That may influence competition and career positioning, but it does not establish a universal degree screen.
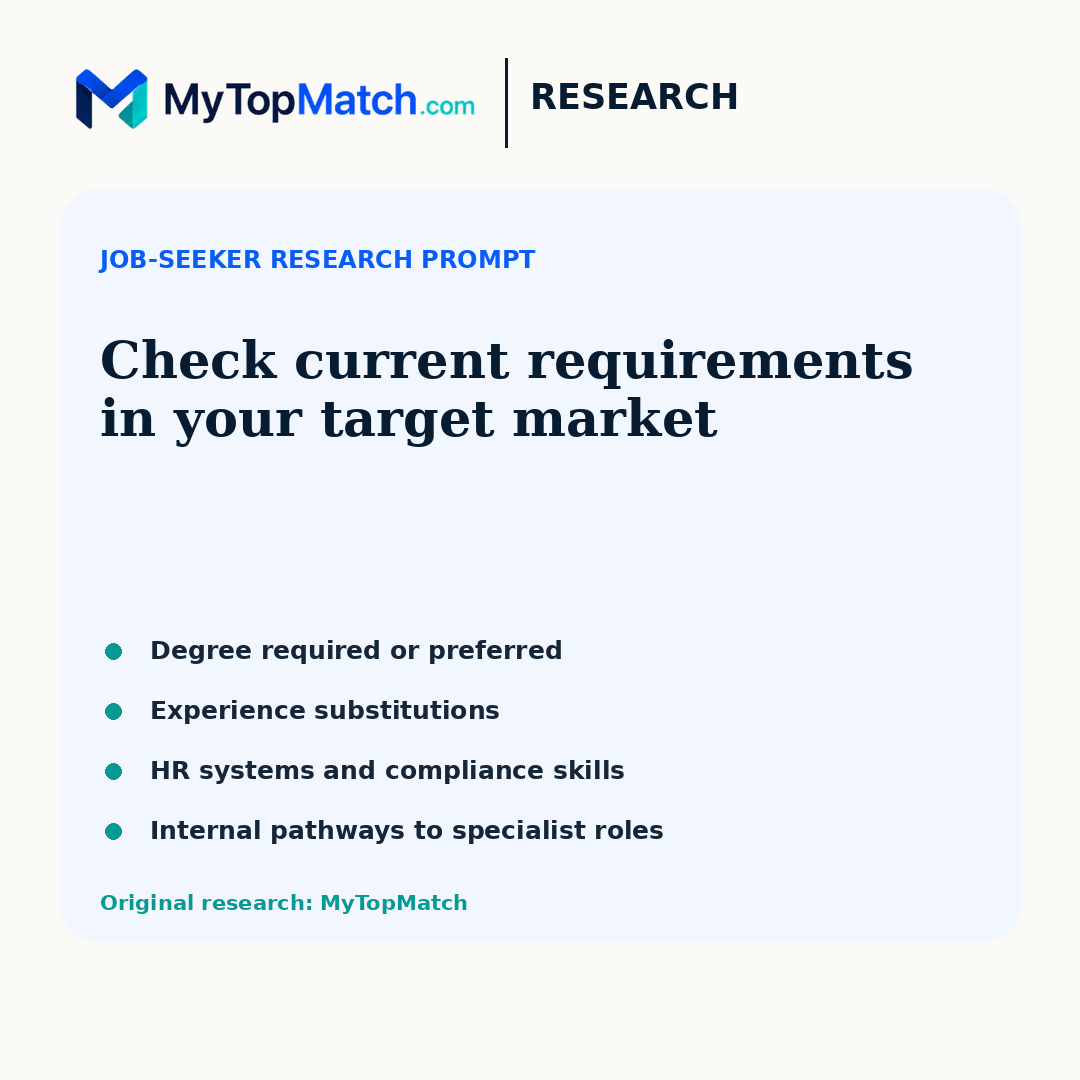
- Review current postings in the target location and industry.
- Separate degree requirements from degree preferences and identify experience substitutions.
- Document HR information-system, records, compliance, reporting, onboarding, scheduling, and communication experience.
- Compare assistant roles with coordinator, specialist, analyst, payroll, and recruiting roles whose preparation expectations may differ.
- Verify whether certifications or regulated duties apply to the specific employer and jurisdiction.
What employers and HR leaders can investigate
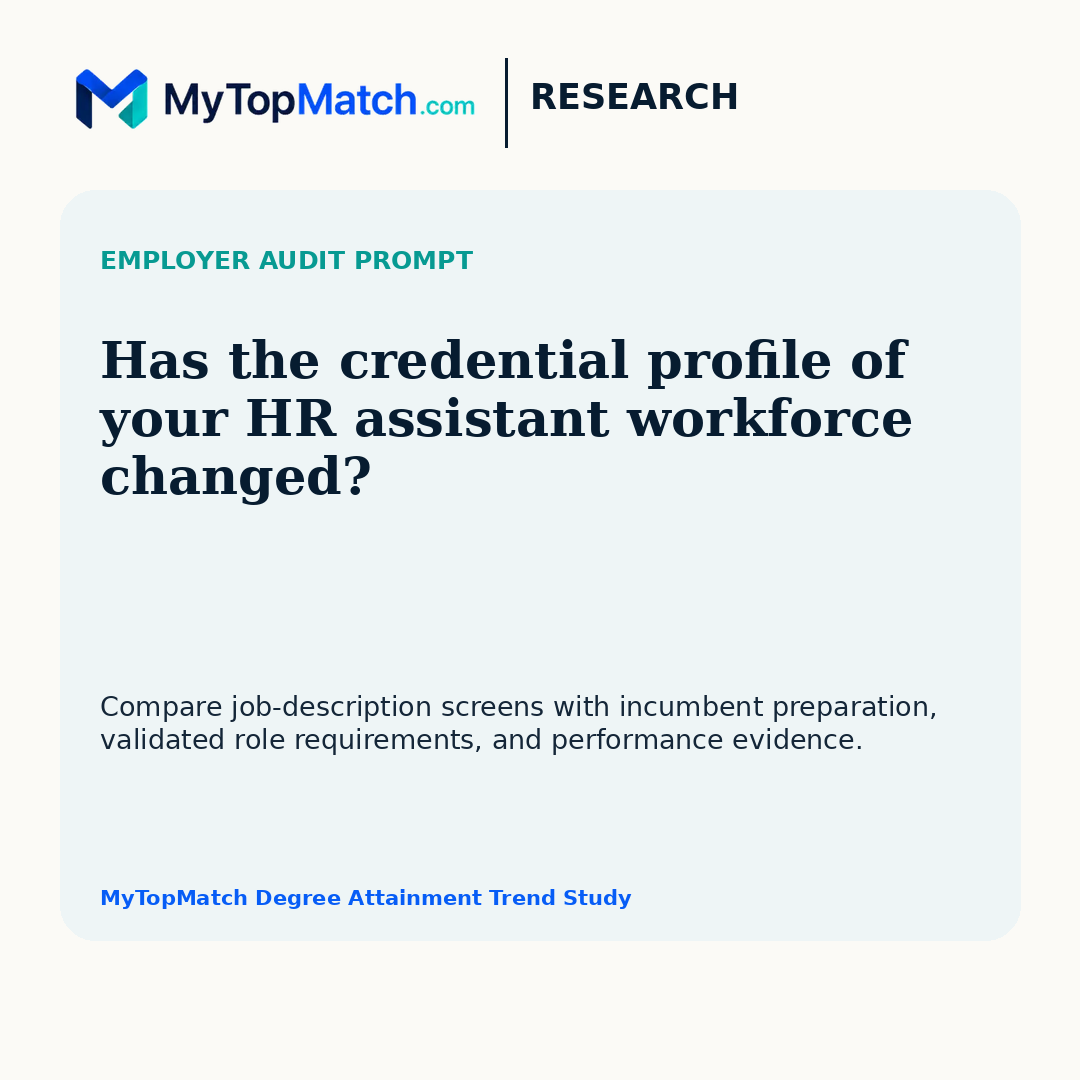
Employers can use the national trend as a workforce-audit prompt. The decisive evidence must come from their own records: job descriptions, screening rules, incumbent preparation, work samples, performance, retention, and advancement.
- Has the bachelor's share among the organization's HR assistants changed?
- Did job descriptions or screening rules change during the same period?
- Which combinations of education, experience, software, compliance, and work-sample evidence predict performance?
- Are assistant roles being used as pipelines into specialist positions?
- Are internal candidates screened consistently with external candidates?
How MyTopMatch calculated the estimates
The preregistered universe includes employed civilian wage-and-salary workers ages 25 to 64 with valid occupation and education data. Bachelor's attainment includes respondents whose highest reported education was a bachelor's, master's, professional, or doctoral degree.
Point estimates use the ACS person weight. Standard errors use all 80 person replicate weights and the Census successive-difference-replication factor of 4/80. Ninety-percent margins of error use a 1.645 multiplier. The endpoint-change standard error combines the independent-year standard errors using the square root of the sum of squares.
Eligibility required a Grade A or Grade B occupation mapping, at least 200 unweighted records at both endpoints, and a relative standard error no greater than 15% for the weighted worker count. Benjamini-Hochberg correction was applied within the prespecified outcome family, and a finding also needed an absolute change of at least five percentage points.
What this research cannot establish
- Employer degree screens, job descriptions, or hiring policies.
- The education workers held when they entered the occupation.
- An individual applicant's hiring probability or job performance.
- Worker-level transitions or a causal mechanism.
- A continuous 2020 observation; no value was imputed.
- Employer-specific job content or legal requirements.
Bachelor's-or-higher share among human resources assistants
| Year | Estimate | 90% confidence interval | Unweighted sample |
|---|---|---|---|
| 2018 | 40.3% | 34.2%–46.3% | 397 |
| 2019 | 45.1% | 40.0%–50.1% | 438 |
| 2020 | Unavailable | No standard one-year estimate | — |
| 2021 | 47.6% | 43.1%–52.1% | 527 |
| 2022 | 47.9% | 44.4%–51.4% | 790 |
| 2023 | 46.7% | 43.9%–49.6% | 864 |
| 2024 | 55.6% | 52.3%–58.9% | 964 |
Source: MyTopMatch Research using 2018, 2019, and 2021–2024 ACS one-year PUMS.
METHODOLOGY
How the analysis was built
Methodology DGT-1.0; finding MTM-DGT-001. Independent ACS one-year cross-sections use person and replicate weights. Endpoint tests combine independent-year standard errors. Benjamini-Hochberg correction is applied within the prespecified outcome family, and publication requires an absolute change of at least five percentage points.
Read the MyTopMatch research standards and methodology framework →
EVIDENCE STANDARD
How to read this research
- SOURCE DATA
- Facts reported by the cited government or occupational-data publishers.
- DERIVED CALCULATIONS
- Values calculated by MyTopMatch from the source data using the documented method.
- STATISTICAL FINDINGS
- Relationships that passed the stated analytical and validation checks.
- INTERPRETATION
- Practical meaning and hypotheses kept separate from directly observed facts.
FREQUENTLY ASKED QUESTIONS
Questions about the finding
Does the finding prove credential inflation?
No. It establishes a change in incumbent educational composition. Employer-driven credential inflation remains an untested explanation.
Why is 2020 missing?
The Census Bureau did not release standard 2020 ACS one-year estimates. The experimental product was excluded to preserve comparability.
What does the q-value represent?
It is the p-value after Benjamini-Hochberg adjustment across eligible occupations in the prespecified outcome family.
PRIMARY SOURCES
Sources and citations
- 2024 ACS PUMS DocumentationU.S. Census Bureau
- 2024 ACS PUMS User GuideU.S. Census Bureau
- 2018 ACS PUMS Documentation and Code ListsU.S. Census Bureau
- 2020 ACS One-Year Experimental Data NoticeU.S. Census Bureau
- Census Guidance on Comparing ACS DataU.S. Census Bureau
- Census Industry and Occupation Code ListsU.S. Census Bureau
- BLS 2018 SOC Definition for Human Resources AssistantsU.S. Bureau of Labor Statistics
- BLS National Employment Matrix-to-ACS Occupation CrosswalkU.S. Bureau of Labor Statistics
- BLS Occupational Projections and Worker Characteristics, 2025–35U.S. Bureau of Labor Statistics
- BLS Education and Training Assignments by Detailed Occupation, 2025U.S. Bureau of Labor Statistics
Source agencies have not approved or endorsed MyTopMatch's transformations, analysis, or conclusions. BLS cannot vouch for analyses created from its data.
CITATION AND REUSE
Cite this original research
MyTopMatch Research. “Bachelor's Attainment Rose 15.3 Percentage Points Among Human Resources Assistants.” MyTopMatch Labor Market Research, 2026. Methodology DGT-1.0. Finding MTM-DGT-001. https://mytopmatch.com/research/hr-assistant-education-trend.
When quoting, summarizing, or reproducing MyTopMatch-created analysis, identify MyTopMatch Research as the analyst and link to this canonical page. The cited government agencies and O*NET remain the underlying data publishers.
MEDIA AND SOCIAL ASSETS
Download the graphics package
These approved assets are ready for website, newsroom, and later social use. Social distribution remains a separate publication action.
- Complete Article #3 visual packagePublication, chart, social, carousel, newsroom, source-data, and documentation assets.
- LinkedIn carousel PDFEight 1080 × 1350 slides, prepared for later social distribution.
- LinkedIn / X graphic1200 × 627 landscape campaign asset.
- Instagram square1080 × 1080 social asset.
- Instagram portrait1080 × 1350 portrait asset.
- Stories / Reels graphic1080 × 1920 vertical asset.
- Citation cardSquare reuse-credit asset with MyTopMatch attribution.
- Employer audit cardSquare workforce-audit prompt for employer audiences.
- Job-seeker cardSquare job-market research prompt for candidates.