
KEY FINDINGS
The finding at a glance
May 2025 median annual wage for management occupations.
Management median divided by the $50,980 all-occupation median.
Difference between the two group medians; not an individual raise estimate.
BLS projected annual average management openings for 2025–35.
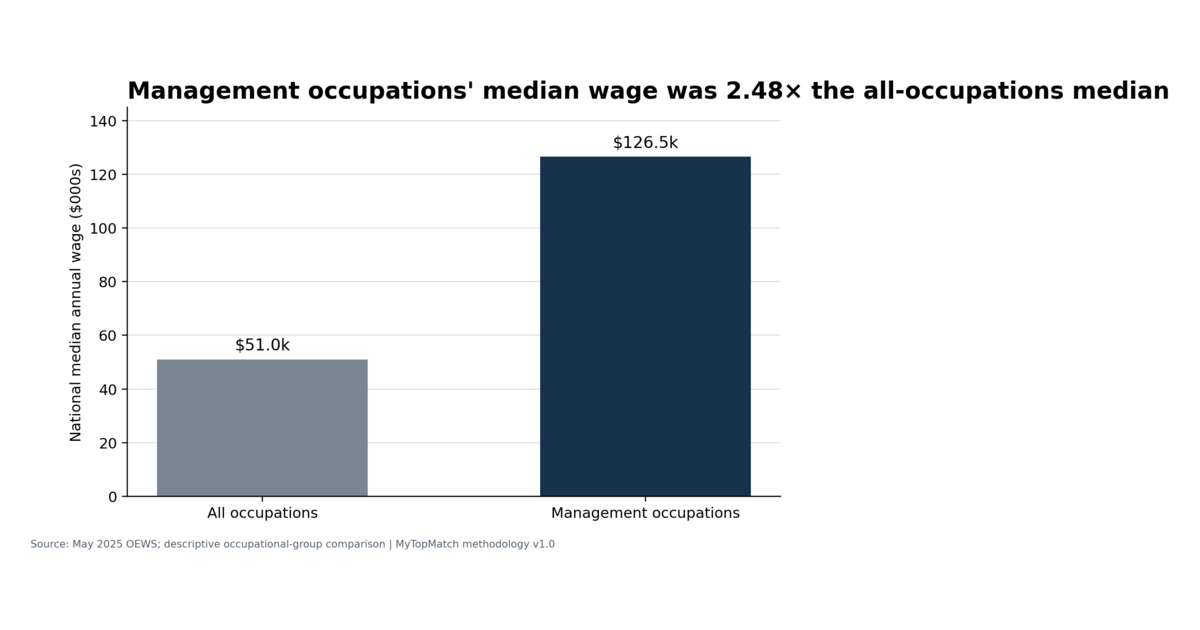
Management occupations had a May 2025 median annual wage of $126,520, compared with $50,980 for all occupations. The resulting ratio is 2.4818, reported as 2.48, and the dollar difference is $75,540.
This is a descriptive comparison between two occupational-group medians. It does not track the same person before and after a promotion or adjust for education, experience, industry, hours, tenure, geography, authority, or selection into management.
The management labor market is large
OEWS estimated 11,132,700 wage-and-salary management jobs in May 2025. BLS Employment Projections, which use a broader jobs universe, project management employment growth of 6.2% from 2025 to 2035 and approximately 1.0817 million annual openings. Openings include growth, occupational transfers, and labor-force exits; they are not a count of posted vacancies.
Among 37 detailed SOC 11 management occupations, medical and health services managers had the highest projected growth rate at 24.2%. General and operations managers had the largest projected annual openings count at 285,000.
Industry comparisons reveal composition
Across 20 reportable sectors and BLS industry designations, the ratio of the management median to the all-occupation median ranged from 1.56 to 2.67. The variation reflects both the mix of management jobs and the comparison workforce inside each sector.
A high management wage level and a high within-industry ratio are different constructs. In the Information sector, for example, the management median was $173,440 while the ratio was 1.81 because the sector's all-occupation median was also high.
Leadership content is related evidence
Selected O*NET work-content measures for management occupations emphasize decision making, communication, coordination, persuasion, instructing, and resource management. MyTopMatch treats these as descriptive occupational content. They do not validate a leadership assessment or prove a pathway from an individual-contributor role into management.
How workers and employers can use the result
Workers should compare specific management occupations and industries, then evaluate responsibility, hours, preparation, local pay, and actual promotion pathways. Employers can examine whether management structures, authority, span of control, and pay bands correspond to the work being performed.
What this research cannot establish
- The causal wage effect of promotion for an individual worker.
- A validated pathway from a specific individual-contributor occupation into management.
- A job-posting-based measure of management title compression.
- The value of benefits, equity, bonuses outside the OEWS wage concept, or every distributional difference.
- A future employment guarantee from the BLS projection.
National management wage comparison
| Measure | Management occupations | All occupations |
|---|---|---|
| Median annual wage, May 2025 | $126,520 | $50,980 |
| Median-wage ratio | 2.48 | Reference |
| Dollar difference | $75,540 | Reference |
Source: MyTopMatch MLE-1.0 using May 2025 BLS Occupational Employment and Wage Statistics.
Management employment and outlook
| Measure | Result |
|---|---|
| OEWS wage-and-salary employment | 11,132,700 |
| Projected growth, 2025–35 | 6.2% |
| Projected annual openings | 1,081,700 |
| Fastest projected growth among 37 SOC 11 occupations | Medical and health services managers: 24.2% |
| Largest projected annual openings count | General and operations managers: 285,000 |
Source: BLS OEWS May 2025 and Employment Projections 2025–35; employment universes differ and are presented separately.
METHODOLOGY
How the analysis was built
Methodology MLE-1.0; finding MTM-MGT-001. National and industry estimates come from May 2025 OEWS; growth and openings come from BLS Employment Projections 2025–35. The national ratio is $126,520 ÷ $50,980. Industry ratios join reportable management and all-occupation medians within 20 broad sectors/designations. No worker-level causal model is estimated.
Read the MyTopMatch research standards and methodology framework →
EVIDENCE STANDARD
How to read this research
- SOURCE DATA
- Facts reported by the cited government or occupational-data publishers.
- DERIVED CALCULATIONS
- Values calculated by MyTopMatch from the source data using the documented method.
- STATISTICAL FINDINGS
- Relationships that passed the stated analytical and validation checks.
- INTERPRETATION
- Practical meaning and hypotheses kept separate from directly observed facts.
FREQUENTLY ASKED QUESTIONS
Questions about the finding
Is 2.48 the pay raise from becoming a manager?
No. It compares two occupational-group medians and does not track workers before and after promotion.
Are projected openings the same as job postings?
No. BLS openings include growth, occupational transfers, and labor-force exits.
Can public data identify the best path into management?
Not yet. A validated pathway analysis requires observed worker transitions and held-out evaluation.
PRIMARY SOURCES
Sources and citations
- BLS Occupational Employment and Wage Statistics TablesU.S. Bureau of Labor Statistics
- BLS OEWS DocumentationU.S. Bureau of Labor Statistics
- BLS Occupational Projections and Worker Characteristics, 2025–35U.S. Bureau of Labor Statistics
- BLS Employment Projections MethodsU.S. Bureau of Labor Statistics
- O*NET 31.0 DatabaseU.S. Department of Labor, Employment and Training Administration
- O*NET 31.0 Database Content LicenseU.S. Department of Labor, Employment and Training AdministrationO*NET 31.0 is used under CC BY 4.0. MyTopMatch modified and combined some information; USDOL/ETA has not approved, endorsed, or tested those modifications.
Source agencies have not approved or endorsed MyTopMatch's transformations, analysis, or conclusions. BLS cannot vouch for analyses created from its data.
This page includes information from the O*NET 31.0 Database by the U.S. Department of Labor, Employment and Training Administration (USDOL/ETA), used under the CC BY 4.0 license. O*NET® is a trademark of USDOL/ETA. MyTopMatch modified and combined some information; USDOL/ETA has not approved, endorsed, or tested those modifications.
CITATION AND REUSE
Cite this original research
MyTopMatch Research. “Management's Median Wage Was 2.48 Times the U.S. All-Occupation Median.” MyTopMatch Labor Market Research, 2026. Methodology MLE-1.0. Finding MTM-MGT-001. https://mytopmatch.com/research/management-wage-economics.
When quoting, summarizing, or reproducing MyTopMatch-created analysis, identify MyTopMatch Research as the analyst and link to this canonical page. The cited government agencies and O*NET remain the underlying data publishers.