
KEY FINDINGS
The finding at a glance
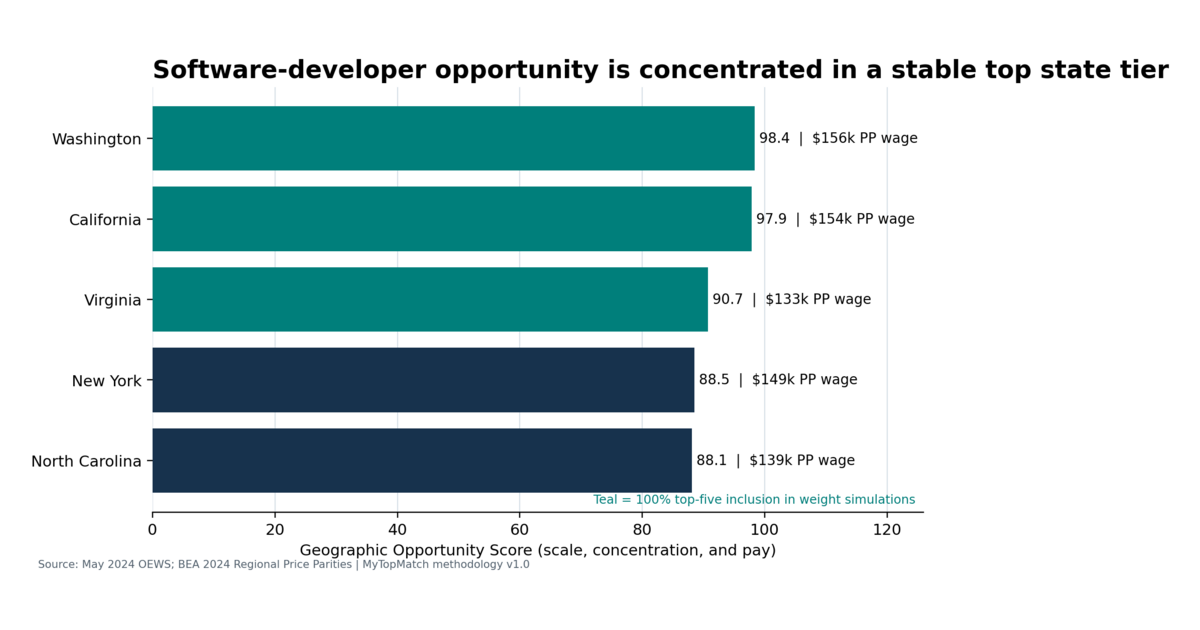
Washington, California, and Virginia had 100% top-five inclusion across 500 primary-method weight draws.
Geographic Opportunity Scores for Washington, California, and Virginia.
Approximate 2024 RPP-adjusted median wages for the three states.
Forty-nine of 51 state and District of Columbia software-developer cells passed the data-quality gates.
Washington, California, and Virginia formed the weight-stable state tier for software developers in MyTopMatch's matched 2024 Geographic Opportunity analysis. Their composite scores were 98.36, 97.88, and 90.74, and their RPP-adjusted median wages were approximately $155,972, $154,362, and $133,002.
Each state appeared in the top five in all 500 frozen pillar-weight draws under the primary robust-CDF normalization. New York and North Carolina completed the primary top five, with inclusion rates of 83.0% and 96.8%. A separate percentile-normalization specification placed Virginia sixth, so the headline is explicitly conditional on the primary scoring architecture.
What the score measures
The index combines three equal pillars: employment scale, occupational concentration, and pay. The pay pillar averages the RPP-adjusted software-developer median with the occupation's median-wage premium relative to the all-occupation median in the same state.
Each component is normalized among eligible state and District of Columbia observations for software developers. A score of 98 indicates a high relative position on the defined inputs. It is not a 98% probability of finding a job or a claim that the state is 98% better than another location.
Three states, three different profiles
Washington combined 91,470 software developers, a 2.41 location quotient, and a nominal median wage of $166,910. California had the largest employment base at 292,630 and a nominal median of $170,910. Virginia combined 83,290 jobs and a 1.91 location quotient with a lower pay pillar.
After applying 2024 all-items Regional Price Parities, Washington's adjusted median slightly exceeded California's. The calculation improves broad purchasing-power comparability across states. It does not reproduce a household budget or capture taxes, equity compensation, remote-work salary policies, or within-state housing variation.
Why the analysis uses matched 2024 data
May 2025 is the latest OEWS edition, while 2024 remains the current RPP price-level year as of publication. MyTopMatch keeps a matched 2024 purchasing-power edition separate from a 2025 nominal reference. This avoids combining a current wage observation with an unmatched price year.
How job seekers can use the tier
Use the tier to shortlist states, then move to metro-level estimates, current openings, and actual offers. Compare base pay, bonus, equity, benefits, taxes, housing, childcare, transportation, work arrangements, employer depth, and personal constraints. A robust state-level position can still be a poor individual choice.
Eligibility and sensitivity
Eligible cells require complete employment, employment relative standard error, location quotient, median wage, local all-occupation median wage, and 2024 RPP. Employment RSE must be no more than 20%. Forty-nine of 51 state/DC cells passed; Alaska exceeded the RSE threshold, and Vermont lacked required employment and concentration inputs.
Important limits
- OEWS covers wage-and-salary jobs and excludes self-employed workers.
- State averages hide metro, neighborhood, and employer variation.
- RPP is an all-items regional price index, not a software-developer or household-specific basket.
- The index does not observe vacancies, hiring probability, taxes, equity compensation, or remote-work eligibility.
- Weight stability inside one normalization is not universal rank stability.
Primary 2024 software-developer results
| State | Score | RPP-adjusted median | Top-five inclusion |
|---|---|---|---|
| Washington | 98.36 | $155,972 | 100.0% |
| California | 97.88 | $154,362 | 100.0% |
| Virginia | 90.74 | $133,002 | 100.0% |
| New York | 88.49 | $149,424 | 83.0% |
| North Carolina | 88.09 | $138,880 | 96.8% |
Source: MyTopMatch GEO-1.0 using May 2024 BLS OEWS and 2024 BEA Regional Price Parities.
METHODOLOGY
How the analysis was built
Methodology GEO-1.0; finding MTM-GEO-001. Employment scale, location quotient, RPP-adjusted median wage, and the within-state occupational wage premium are robust-CDF normalized among eligible areas. The primary score equally weights scale, concentration, and pay. Sensitivity includes 500 frozen pillar-weight draws, mean-wage substitution, and percentile normalization.
Read the MyTopMatch research standards and methodology framework →
EVIDENCE STANDARD
How to read this research
- SOURCE DATA
- Facts reported by the cited government or occupational-data publishers.
- DERIVED CALCULATIONS
- Values calculated by MyTopMatch from the source data using the documented method.
- STATISTICAL FINDINGS
- Relationships that passed the stated analytical and validation checks.
- INTERPRETATION
- Practical meaning and hypotheses kept separate from directly observed facts.
FREQUENTLY ASKED QUESTIONS
Questions about the finding
Is 100% top-five inclusion a confidence level?
No. It is the observed inclusion rate across 500 designed weight draws within the primary normalization.
Why use 2024 rather than 2025 wages?
The purchasing-power edition matches May 2024 OEWS with 2024 RPP. A 2025 nominal reference is kept separate until matching price data are available.
Does the index identify the best state for every developer?
No. It does not observe individual offers, taxes, household costs, remote-work rules, employer quality, or personal preferences.
PRIMARY SOURCES
Sources and citations
- May 2024 OEWS State Occupational EstimatesU.S. Bureau of Labor Statistics
- BLS Occupational Employment and Wage Statistics TablesU.S. Bureau of Labor Statistics
- BEA Regional Price ParitiesU.S. Bureau of Economic Analysis
- BLS OEWS DocumentationU.S. Bureau of Labor Statistics
Source agencies have not approved or endorsed MyTopMatch's transformations, analysis, or conclusions. BLS cannot vouch for analyses created from its data.
CITATION AND REUSE
Cite this original research
MyTopMatch Research. “Washington, California, and Virginia Formed a Weight-Stable State Tier for Software Developers.” MyTopMatch Labor Market Research, 2026. Methodology GEO-1.0. Finding MTM-GEO-001. https://mytopmatch.com/research/software-developer-geographic-opportunity.
When quoting, summarizing, or reproducing MyTopMatch-created analysis, identify MyTopMatch Research as the analyst and link to this canonical page. The cited government agencies and O*NET remain the underlying data publishers.