KEY FINDINGS
The finding at a glance
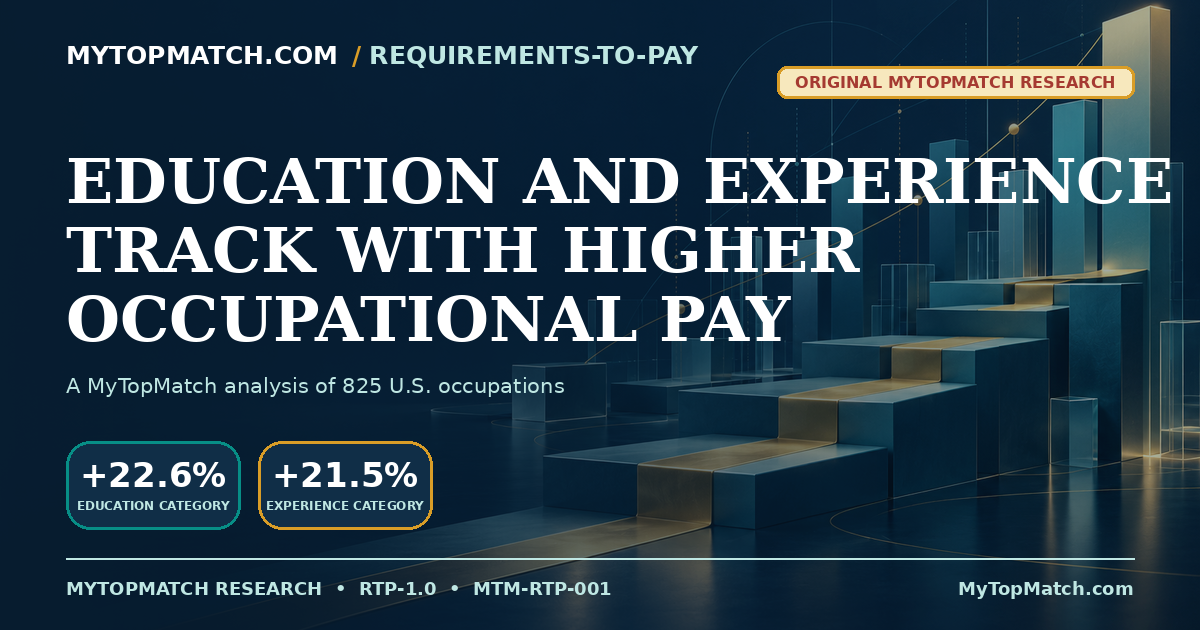
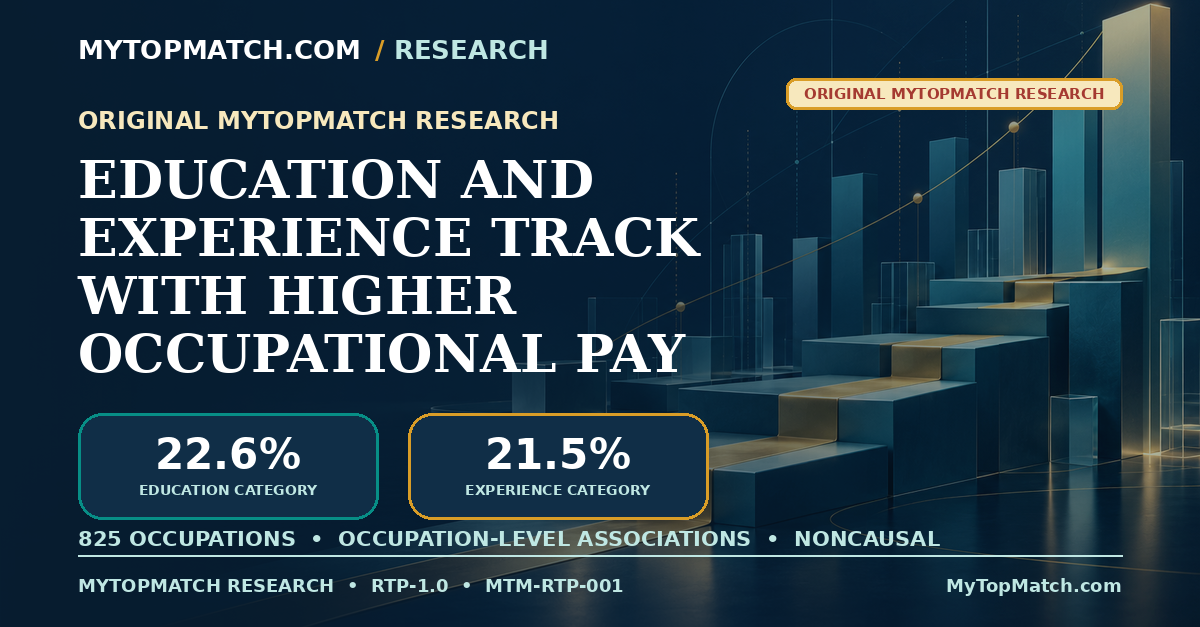
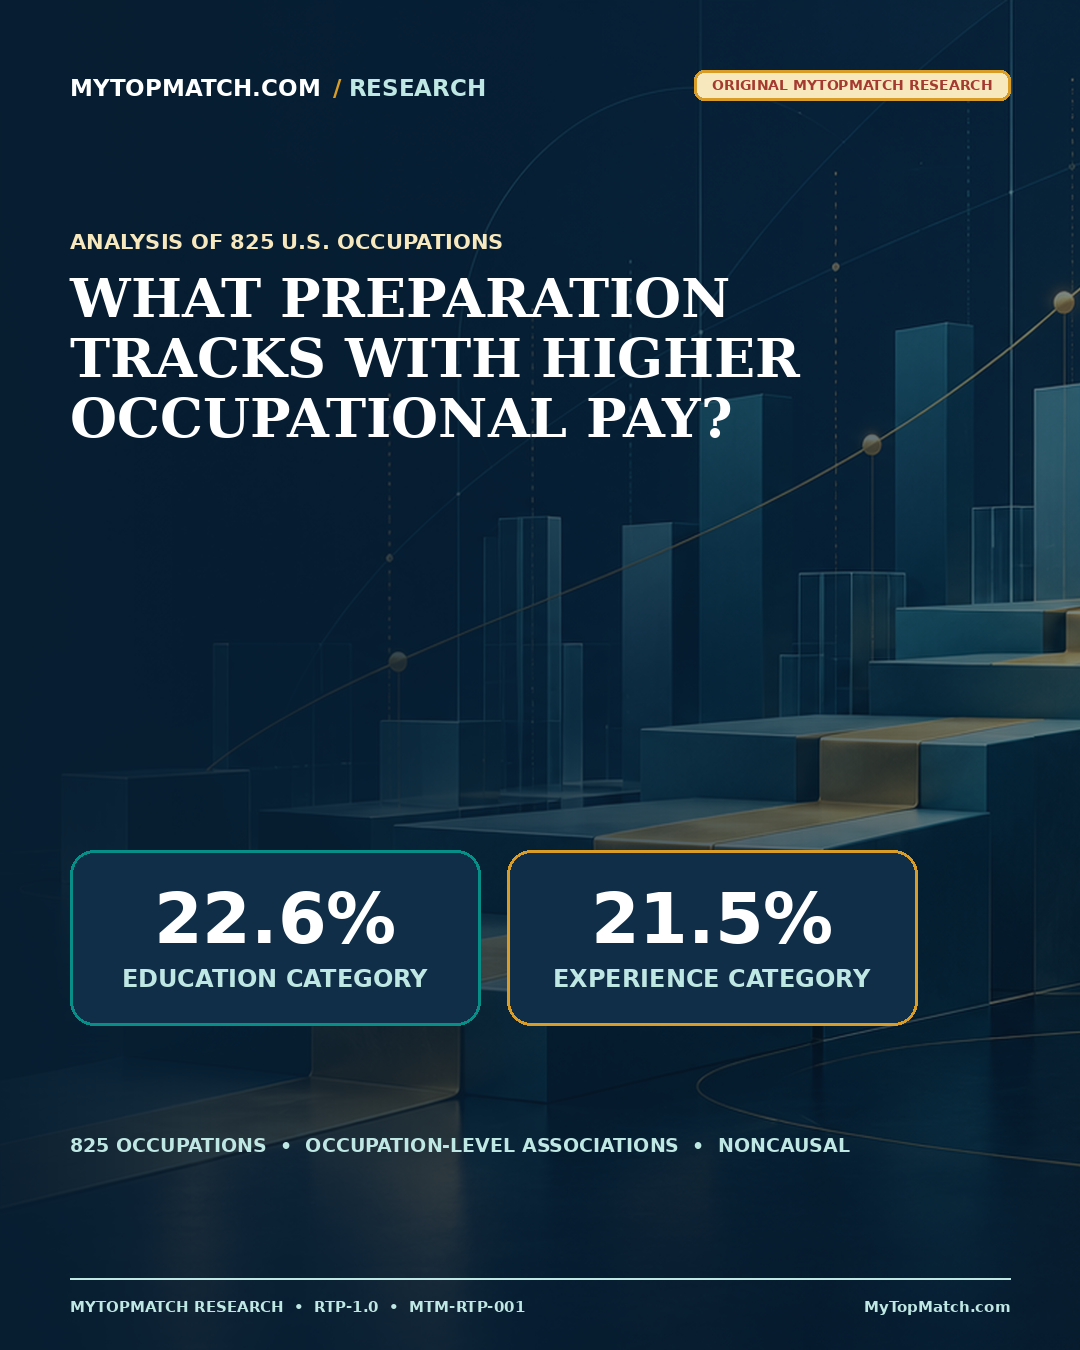
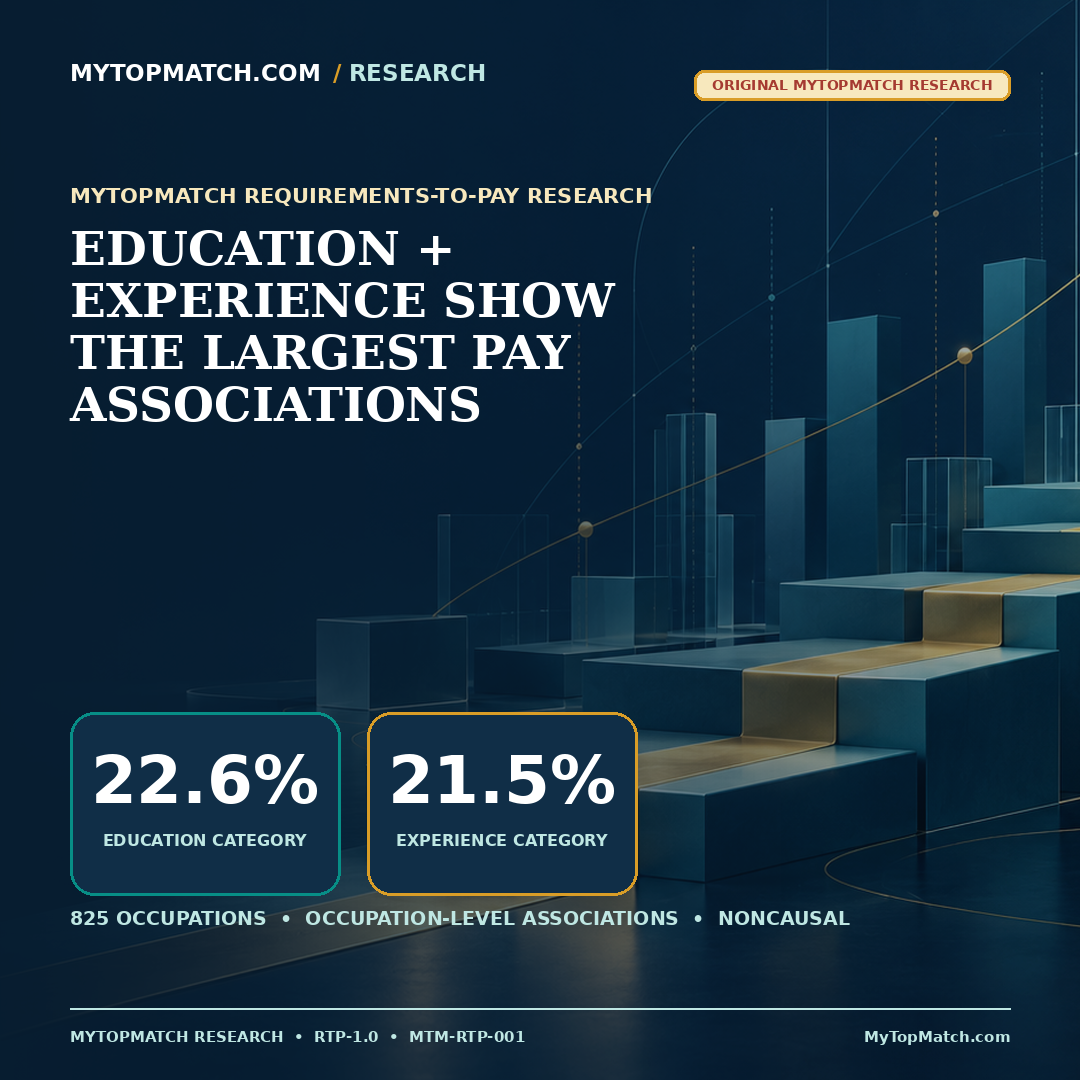
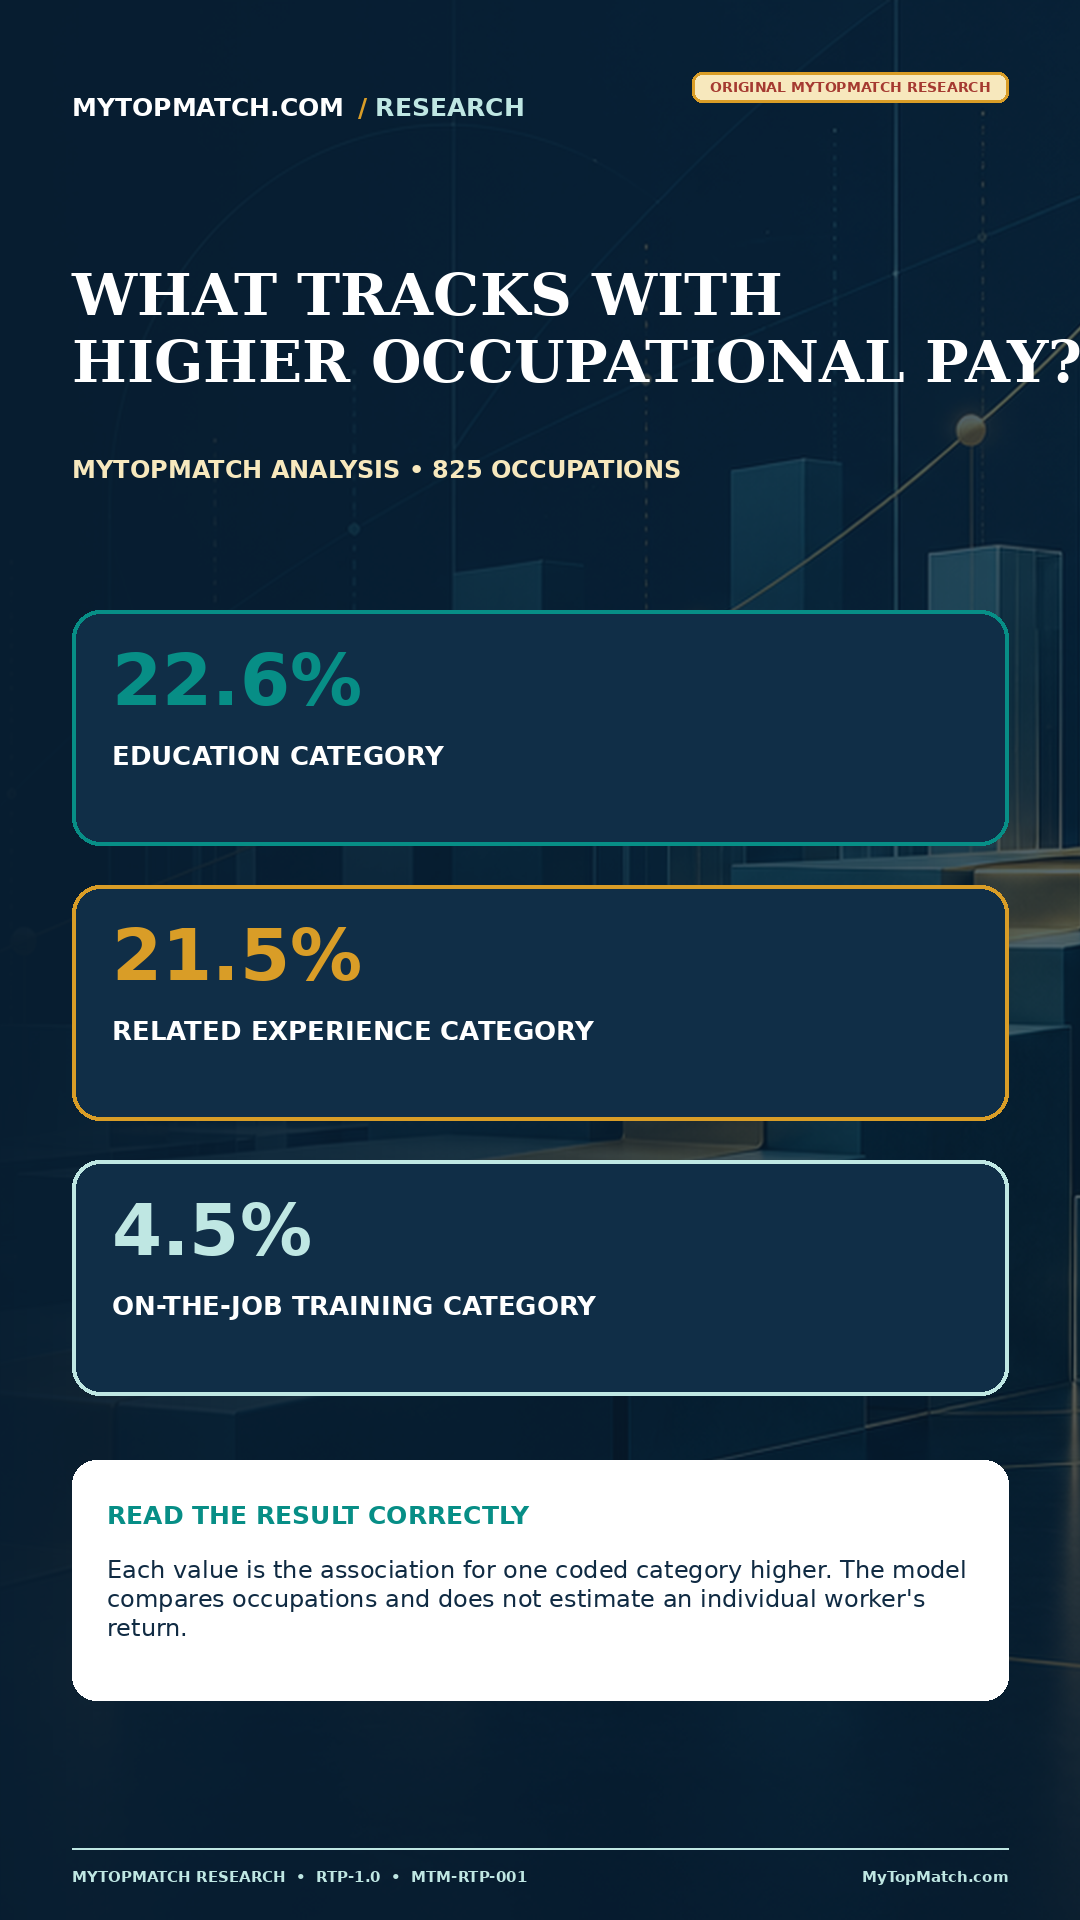
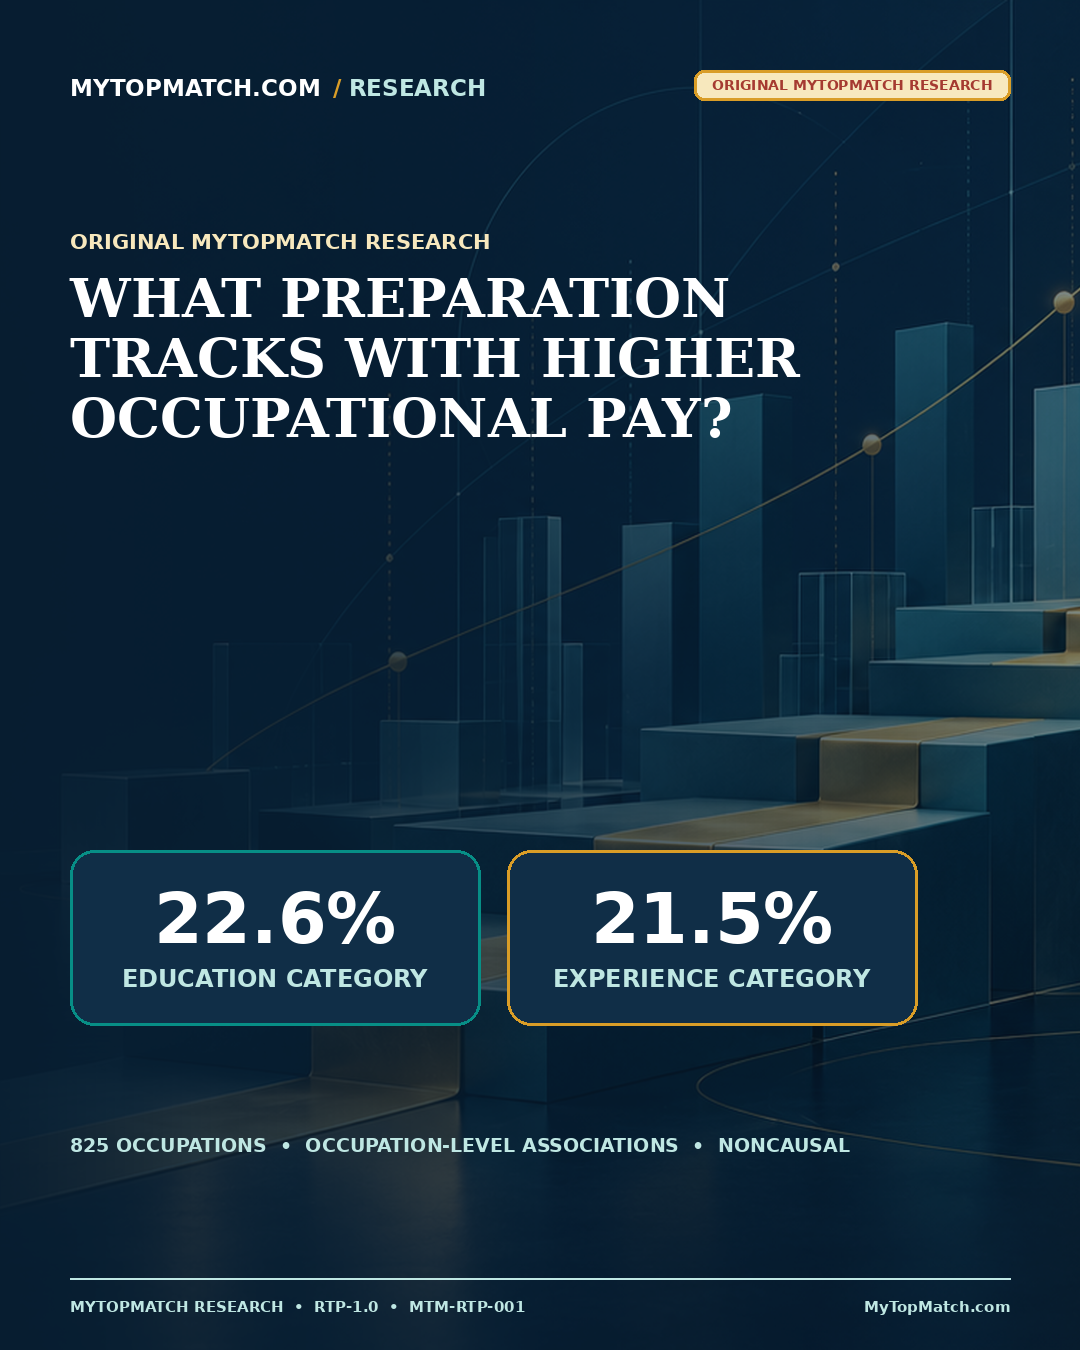
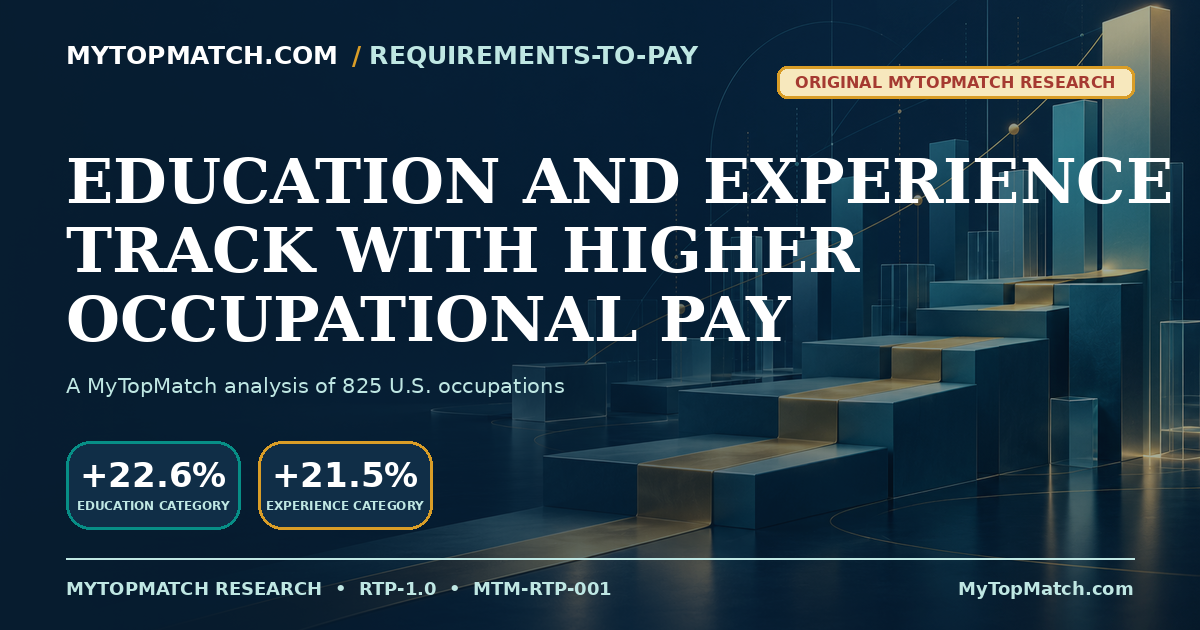
Approximate pay association for one coded typical-entry education category higher.
Approximate pay association for one coded related-experience category higher.
In-sample fit for cross-occupation log median wages under the primary specification.
The education estimate fell when the broader O*NET preparation measure was included.
CHARTS AND GRAPHICS
The evidence in view
Each figure identifies the source, methodology record, and finding ID. Downloadable publication and social formats are available below.
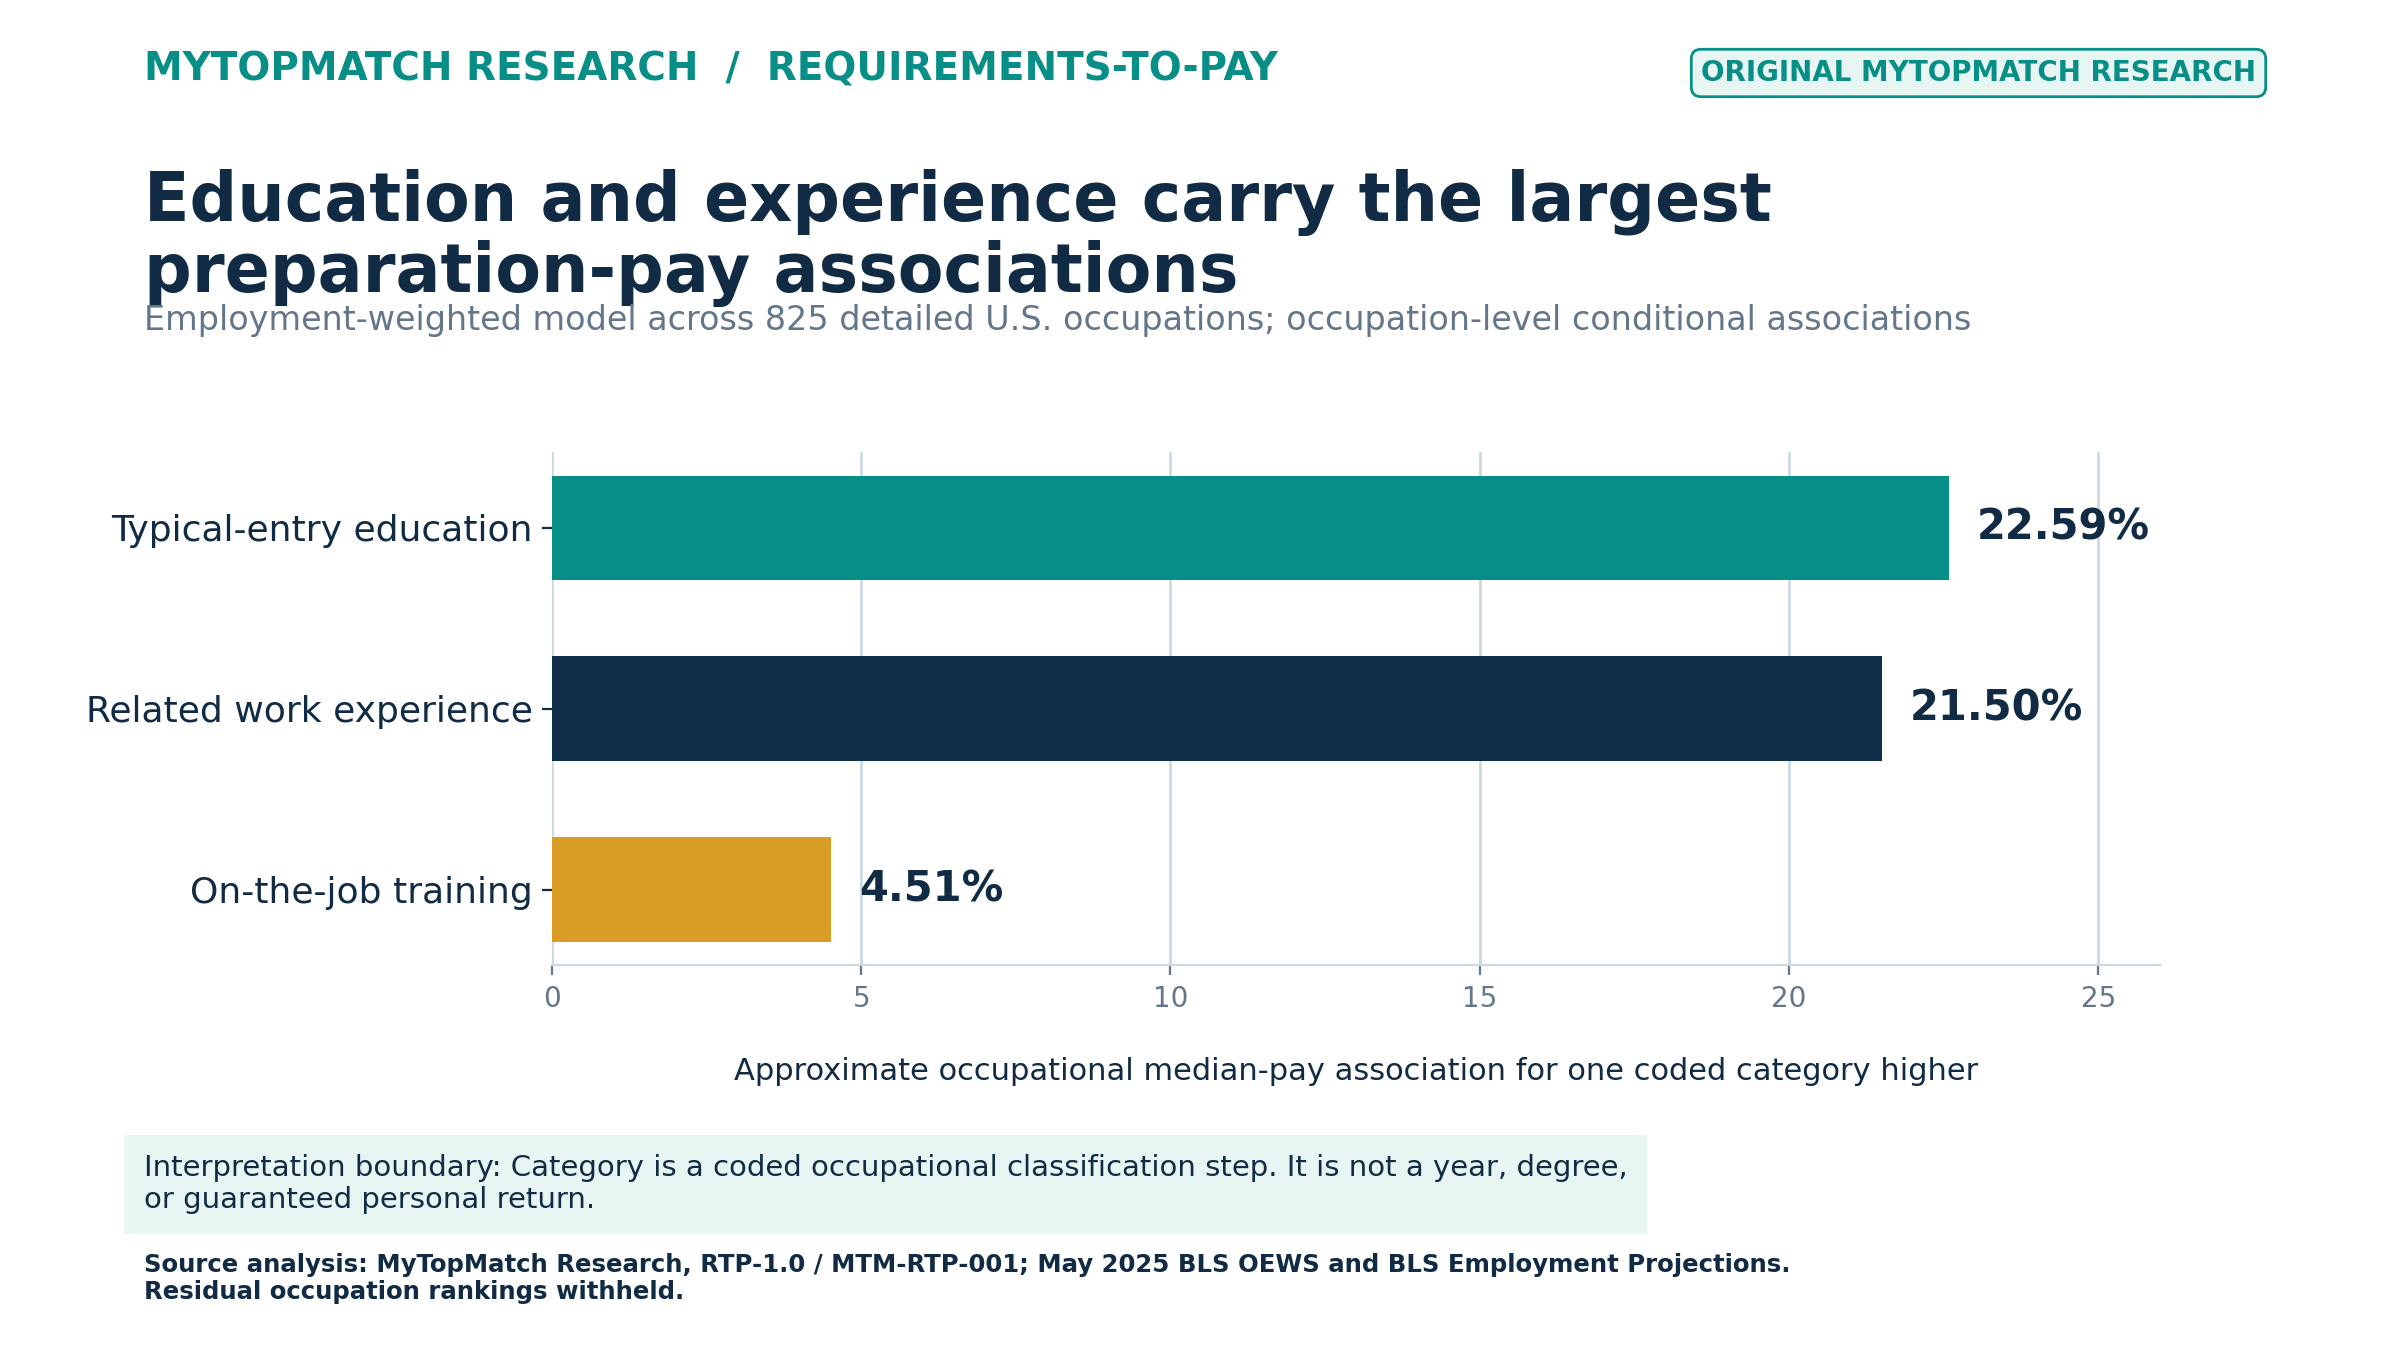
Across 825 detailed U.S. occupations, one coded category higher in BLS typical-entry education was associated with 22.59% higher occupational median pay in MyTopMatch's primary employment-weighted model. A one-category increase in related work experience was associated with 21.50% higher pay, and one category higher in typical on-the-job training was associated with 4.51% higher pay.
The model included all three preparation measures together with broad occupation-family fixed effects and explained 85.5% of weighted cross-occupation variation in log median wages. These figures compare occupations. They do not estimate what an individual would earn after completing a degree or accumulating more experience.
One category is not one year
BLS classifies typical education needed for entry in eight categories: no formal educational credential, high school diploma or equivalent, some college without a degree, postsecondary nondegree award, associate degree, bachelor's degree, master's degree, and doctoral or professional degree.
Related work experience has three categories: none, less than five years, and five years or more. Typical on-the-job training has six categories: none, short-term, moderate-term, long-term, apprenticeship, and internship or residency.
The measures are ordered occupational classifications. Their steps are unequal in time, cost, difficulty, and selectivity. Moving from high school to some college differs from moving from a bachelor's to a master's degree. Apprenticeship and internship or residency describe structured pathways rather than a shared duration.
The coefficients should therefore be read as conditional associations with a one-step change in the frozen coding scheme. They should not be multiplied by years or treated as universal credential premiums.
Education and experience carry the largest primary associations
The education and related-experience estimates were close in magnitude and appeared in the same model with on-the-job training and occupation-family controls. Education may represent technical knowledge, professional pathways, screening, or selection. Experience may represent judgment, responsibility, scarcity, employer trust, or advancement structures.
The regression identifies conditional relationships after accounting for the included variables. It does not distinguish among the mechanisms that produced them.
The 85.5% model fit has a narrow meaning
The weighted R-squared indicates that the fitted model accounted for a large share of in-sample, employment-weighted variation in occupational log median wages. Larger occupations received more weight.
The measure is not an individual wage-prediction accuracy score. Hours, industry, geography, benefits, unionization, working conditions, responsibility, scarcity, and worker selection remain outside the primary specification.
Job Zone changes the education estimate
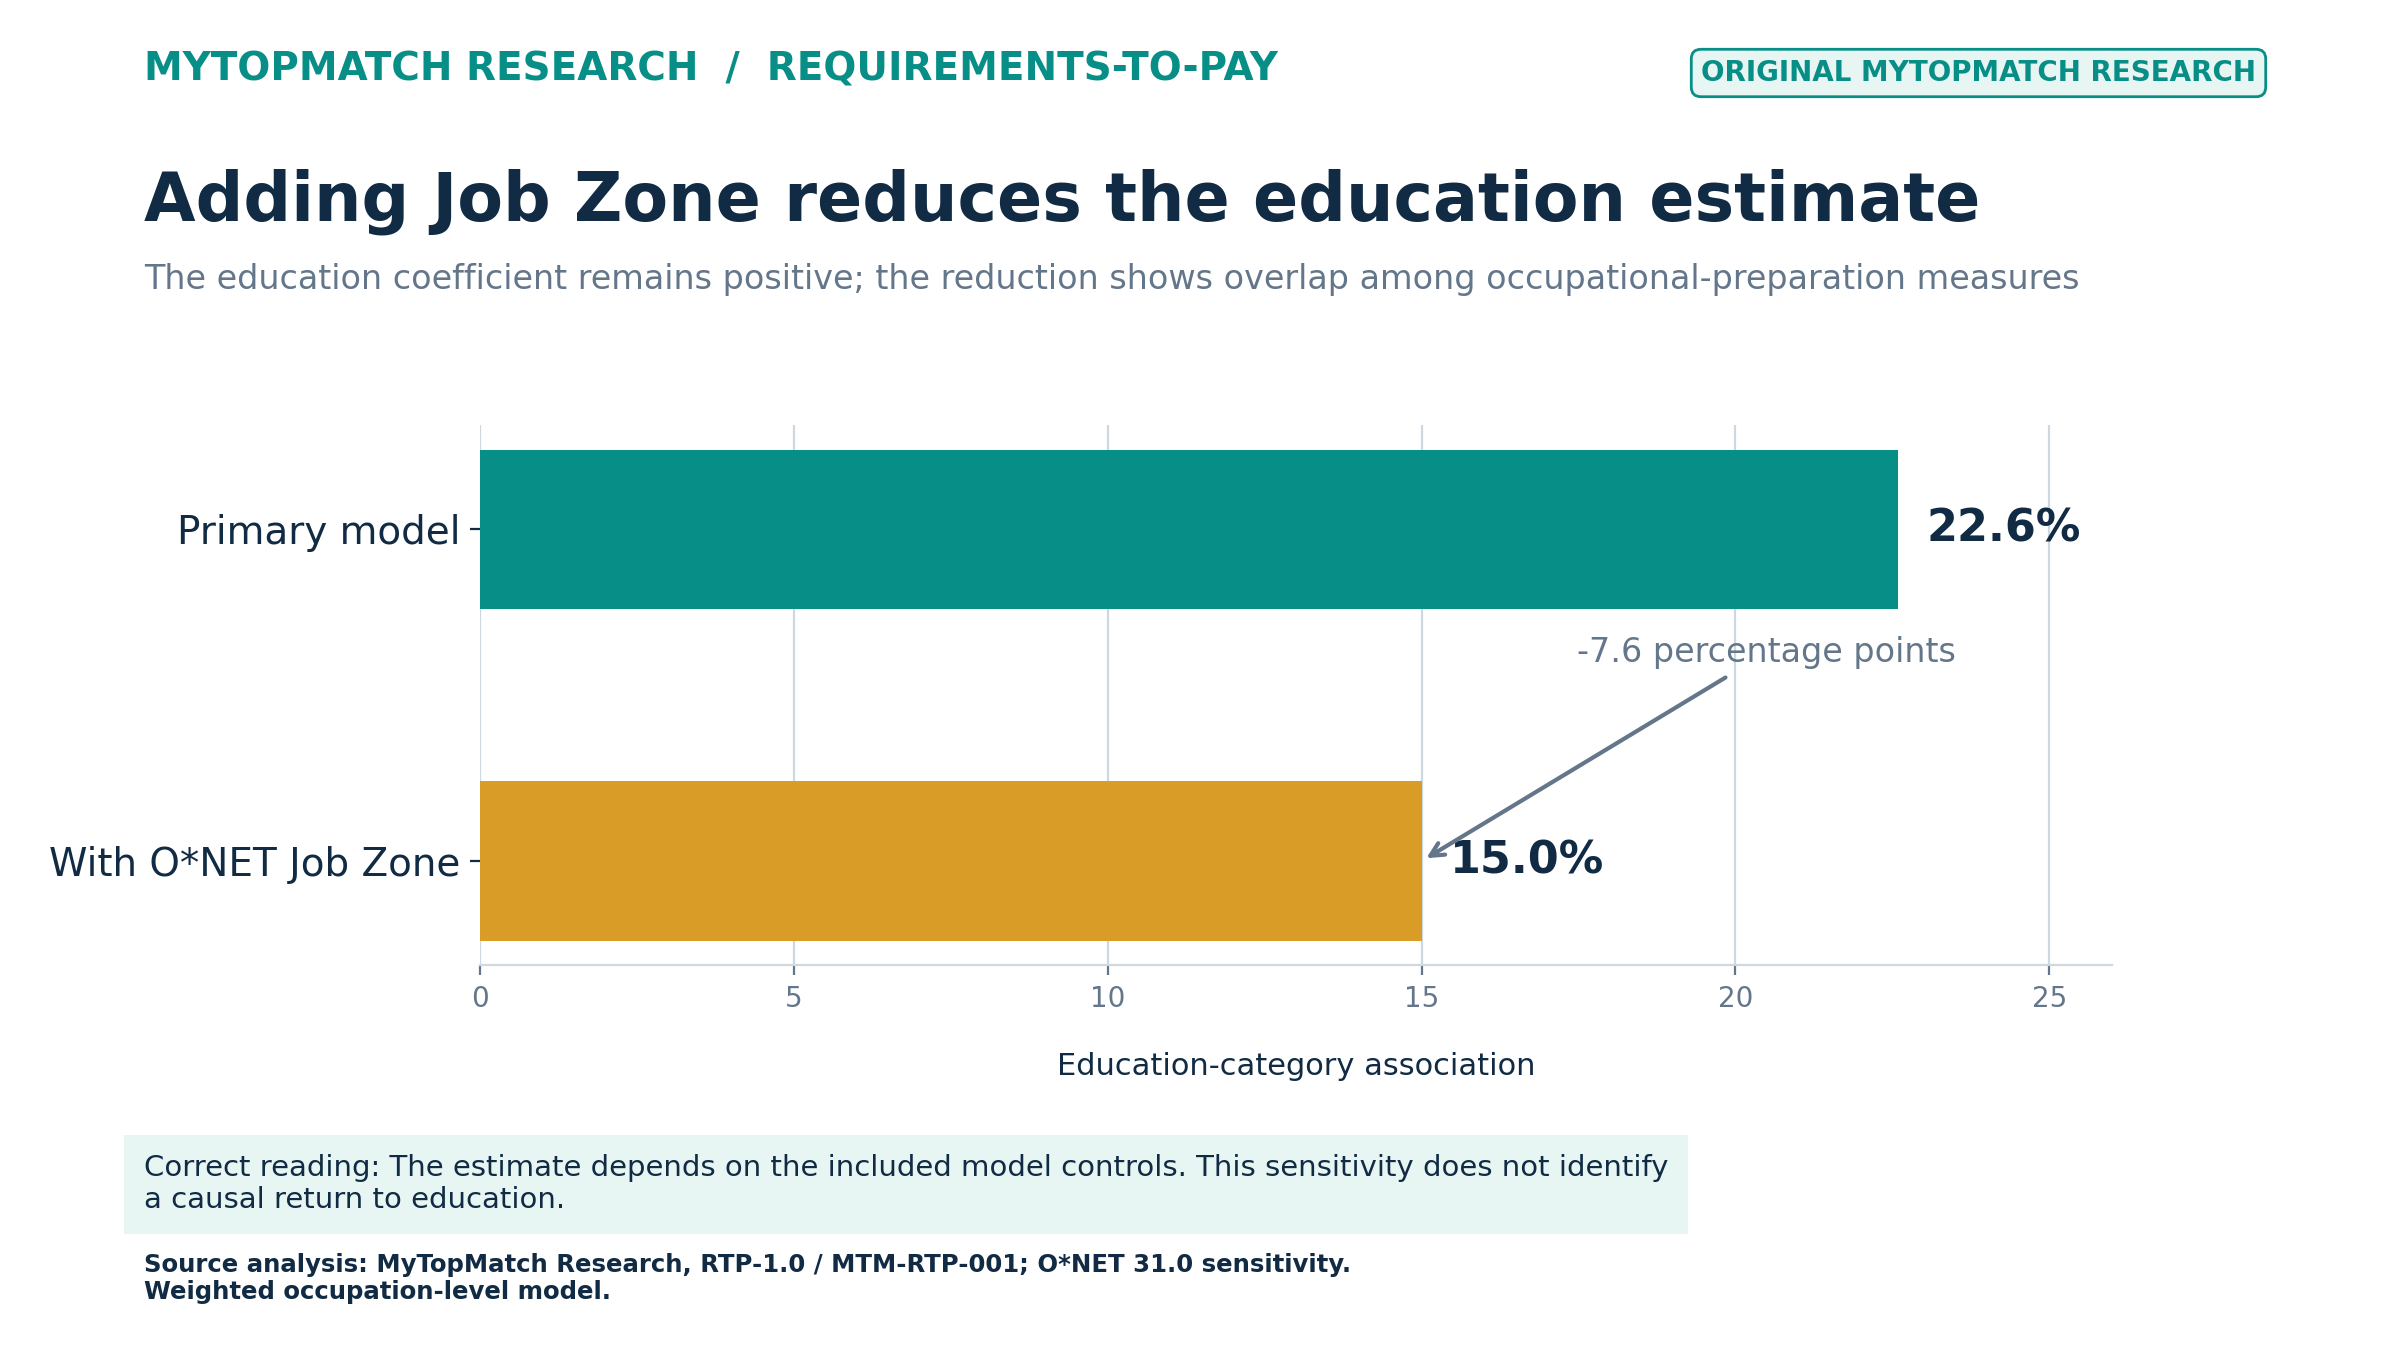
Adding O*NET Job Zone reduced the estimated education-category association from 22.6% to 15.0%. Job Zone summarizes education, experience, and training and overlaps with the BLS inputs. The reduction shows that broader preparation measures share information, so the sensitivity estimate belongs beside the primary coefficient.
Both values define the public result. The 22.6% figure represents the primary frozen specification. The 15.0% figure shows how the estimate changes after adding an overlapping preparation measure.
The training estimate is less stable
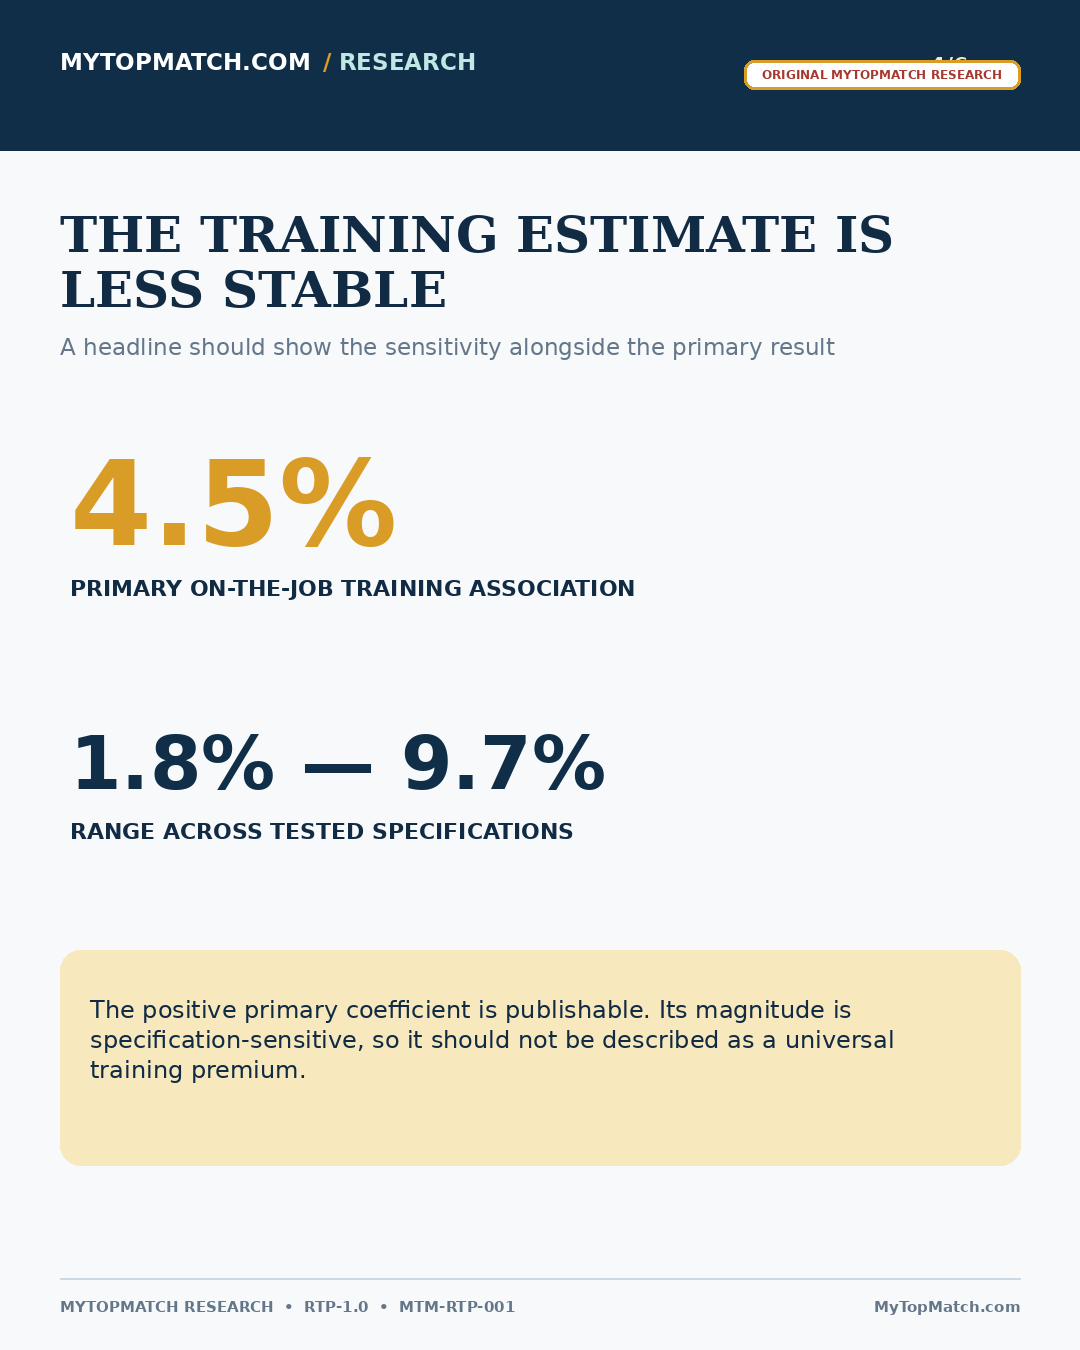
The on-the-job-training estimate ranged from about 1.8% to 9.7% across tested specifications. The direction was positive in the primary model, while the magnitude was materially sensitive to model design. MyTopMatch treats it as secondary evidence.
Why residual occupation rankings remain withheld
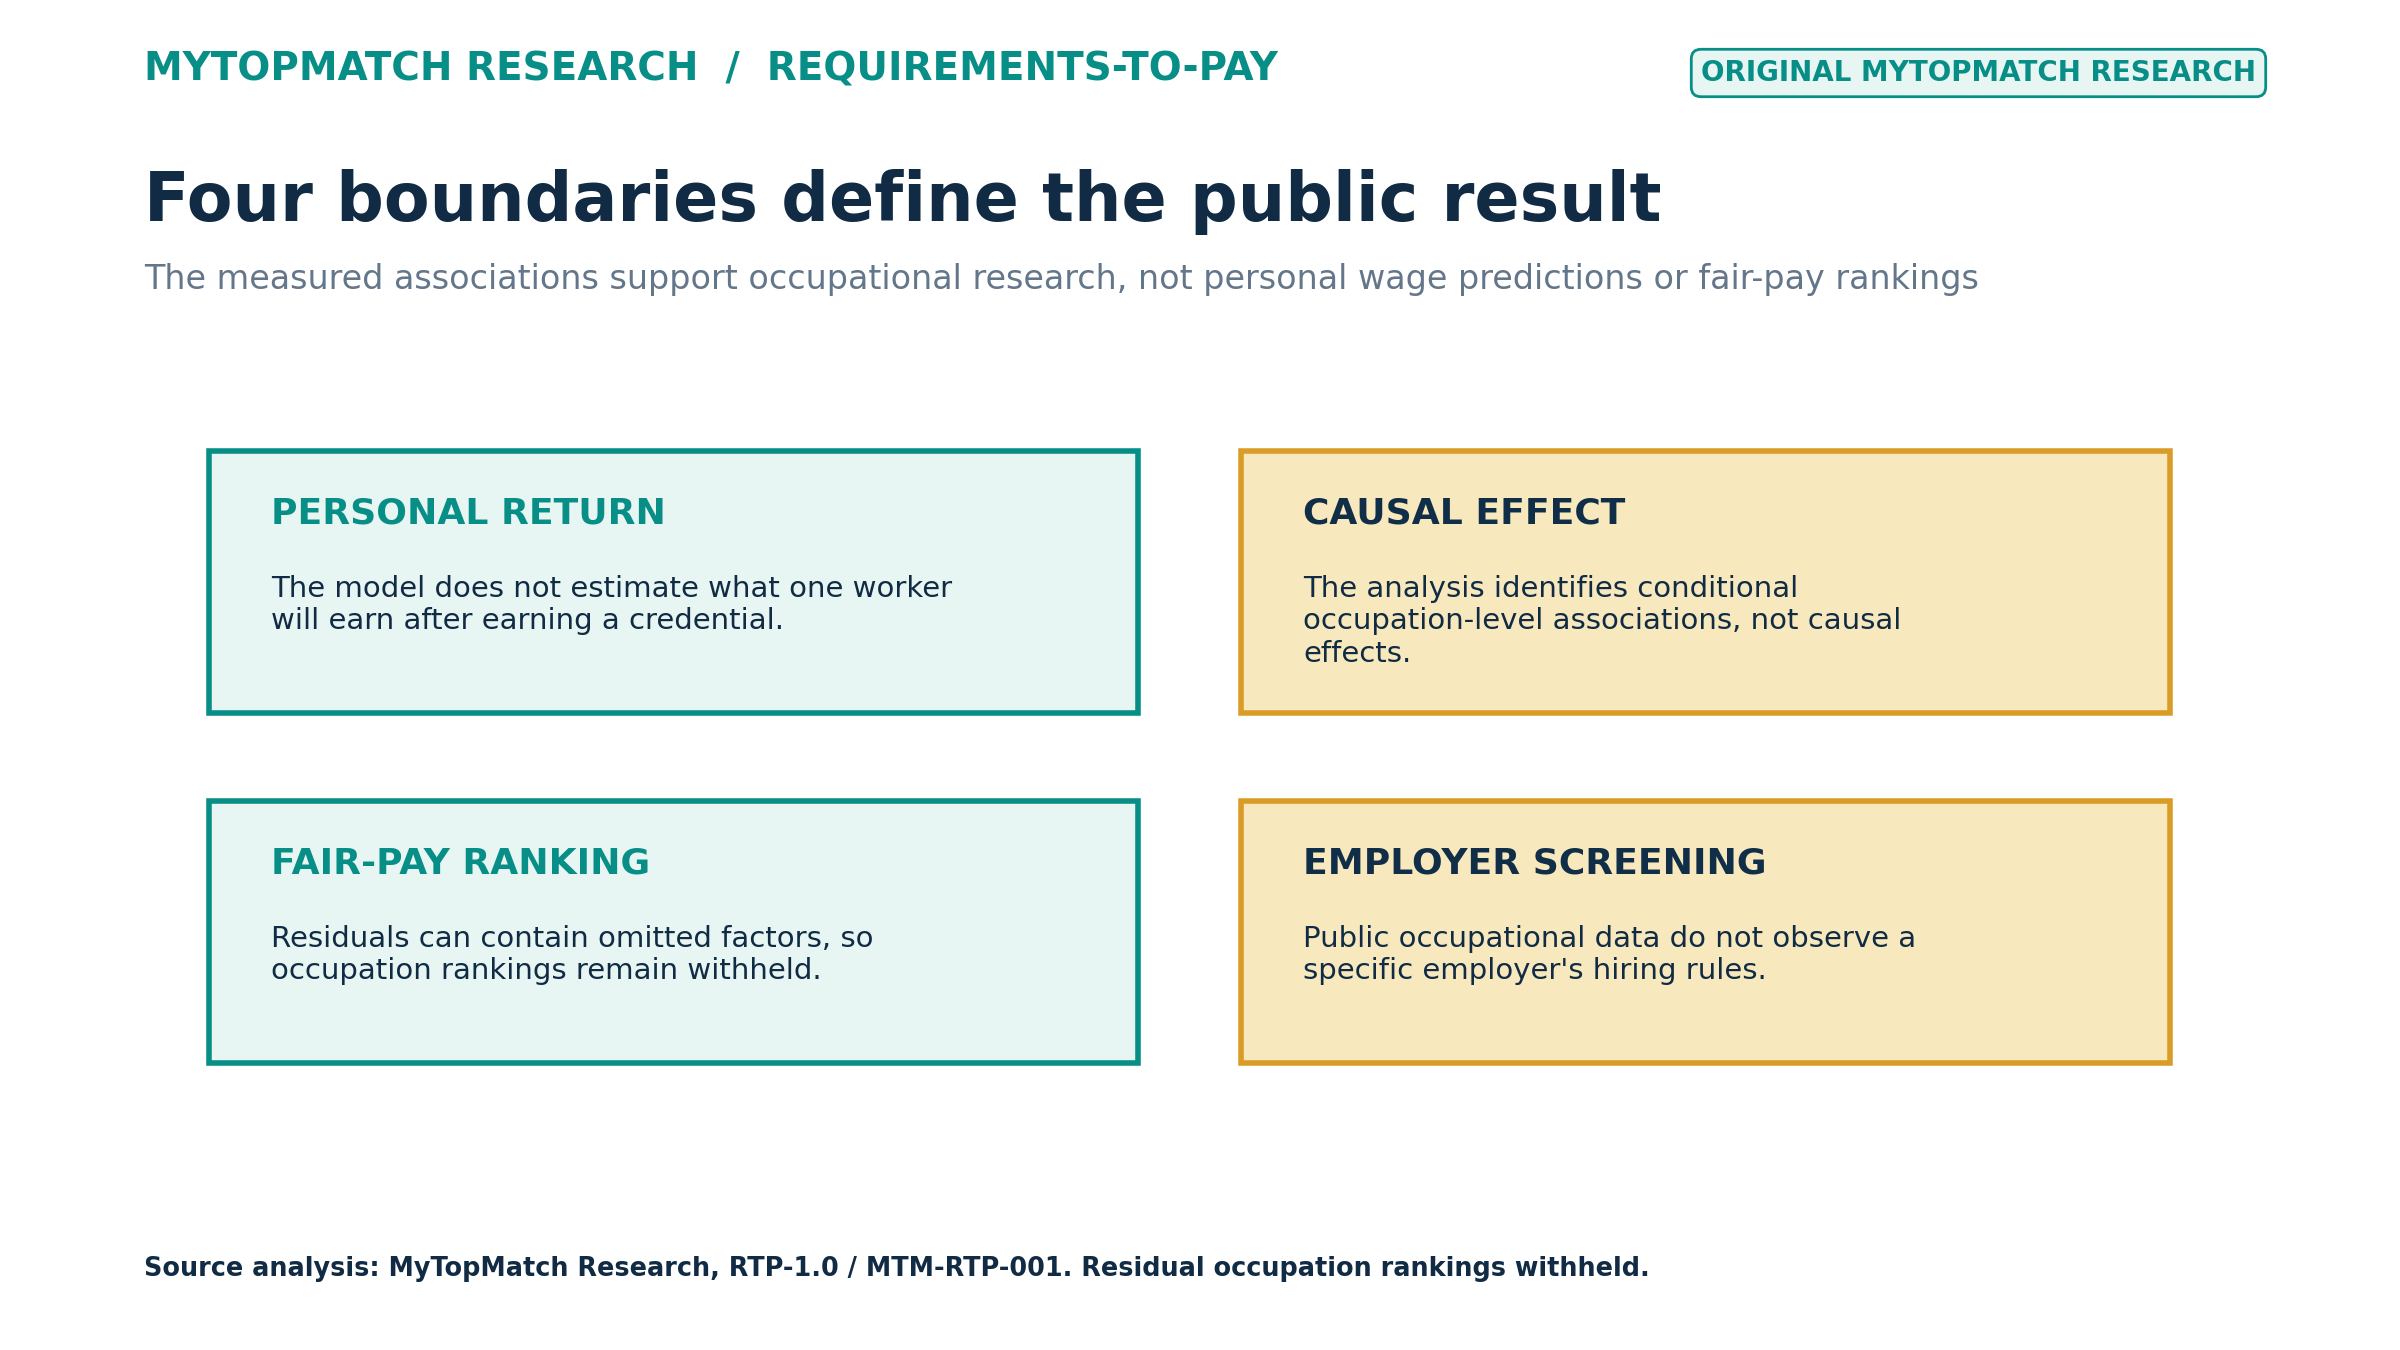
An occupation's residual is the difference between observed and model-predicted log pay. Large positive or negative residuals can identify cases for deeper research. They do not establish that an occupation is overpaid, underpaid, unfairly paid, undervalued, or a good bargain.
Residuals can include measurement error and omitted factors such as hours, industry mix, location, working conditions, risk, unionization, benefits, responsibility, firm productivity, scarcity, and selection. MyTopMatch has withheld the occupation names and residual ranks.
What workers can do with the result
The analysis supports a structured comparison of preparation and opportunity costs. Workers should compare the national entry classification with current programs, employers, and local requirements, then calculate tuition, fees, foregone earnings, completion probability, debt, and time to credential.
- Review occupation-specific wage distributions instead of applying the 22.6% category estimate to a personal salary.
- Evaluate experience-based pathways, apprenticeships, paid employer training, and progression routes alongside degrees.
- Compare schedules, benefits, geography, legal requirements, working conditions, and job stability.
- Treat national occupational medians as reference points rather than promised offers.
Questions for employers and workforce organizations
Preparation requirements and compensation should be reviewed together. Public occupational data can identify national patterns. Employer records and audited job-posting data are required to test actual screening, applicant flow, hiring decisions, performance, and promotion.
- Which degree or experience requirements are legally necessary?
- Which requirements predict performance, safety, retention, or advancement?
- Can a skills demonstration, apprenticeship, or structured training program replace a broad credential screen?
- Do pay bands reflect the time and opportunity cost imposed by entry requirements?
- Where do actual employer requirements differ from the BLS typical-entry classification?
How MyTopMatch estimated the associations
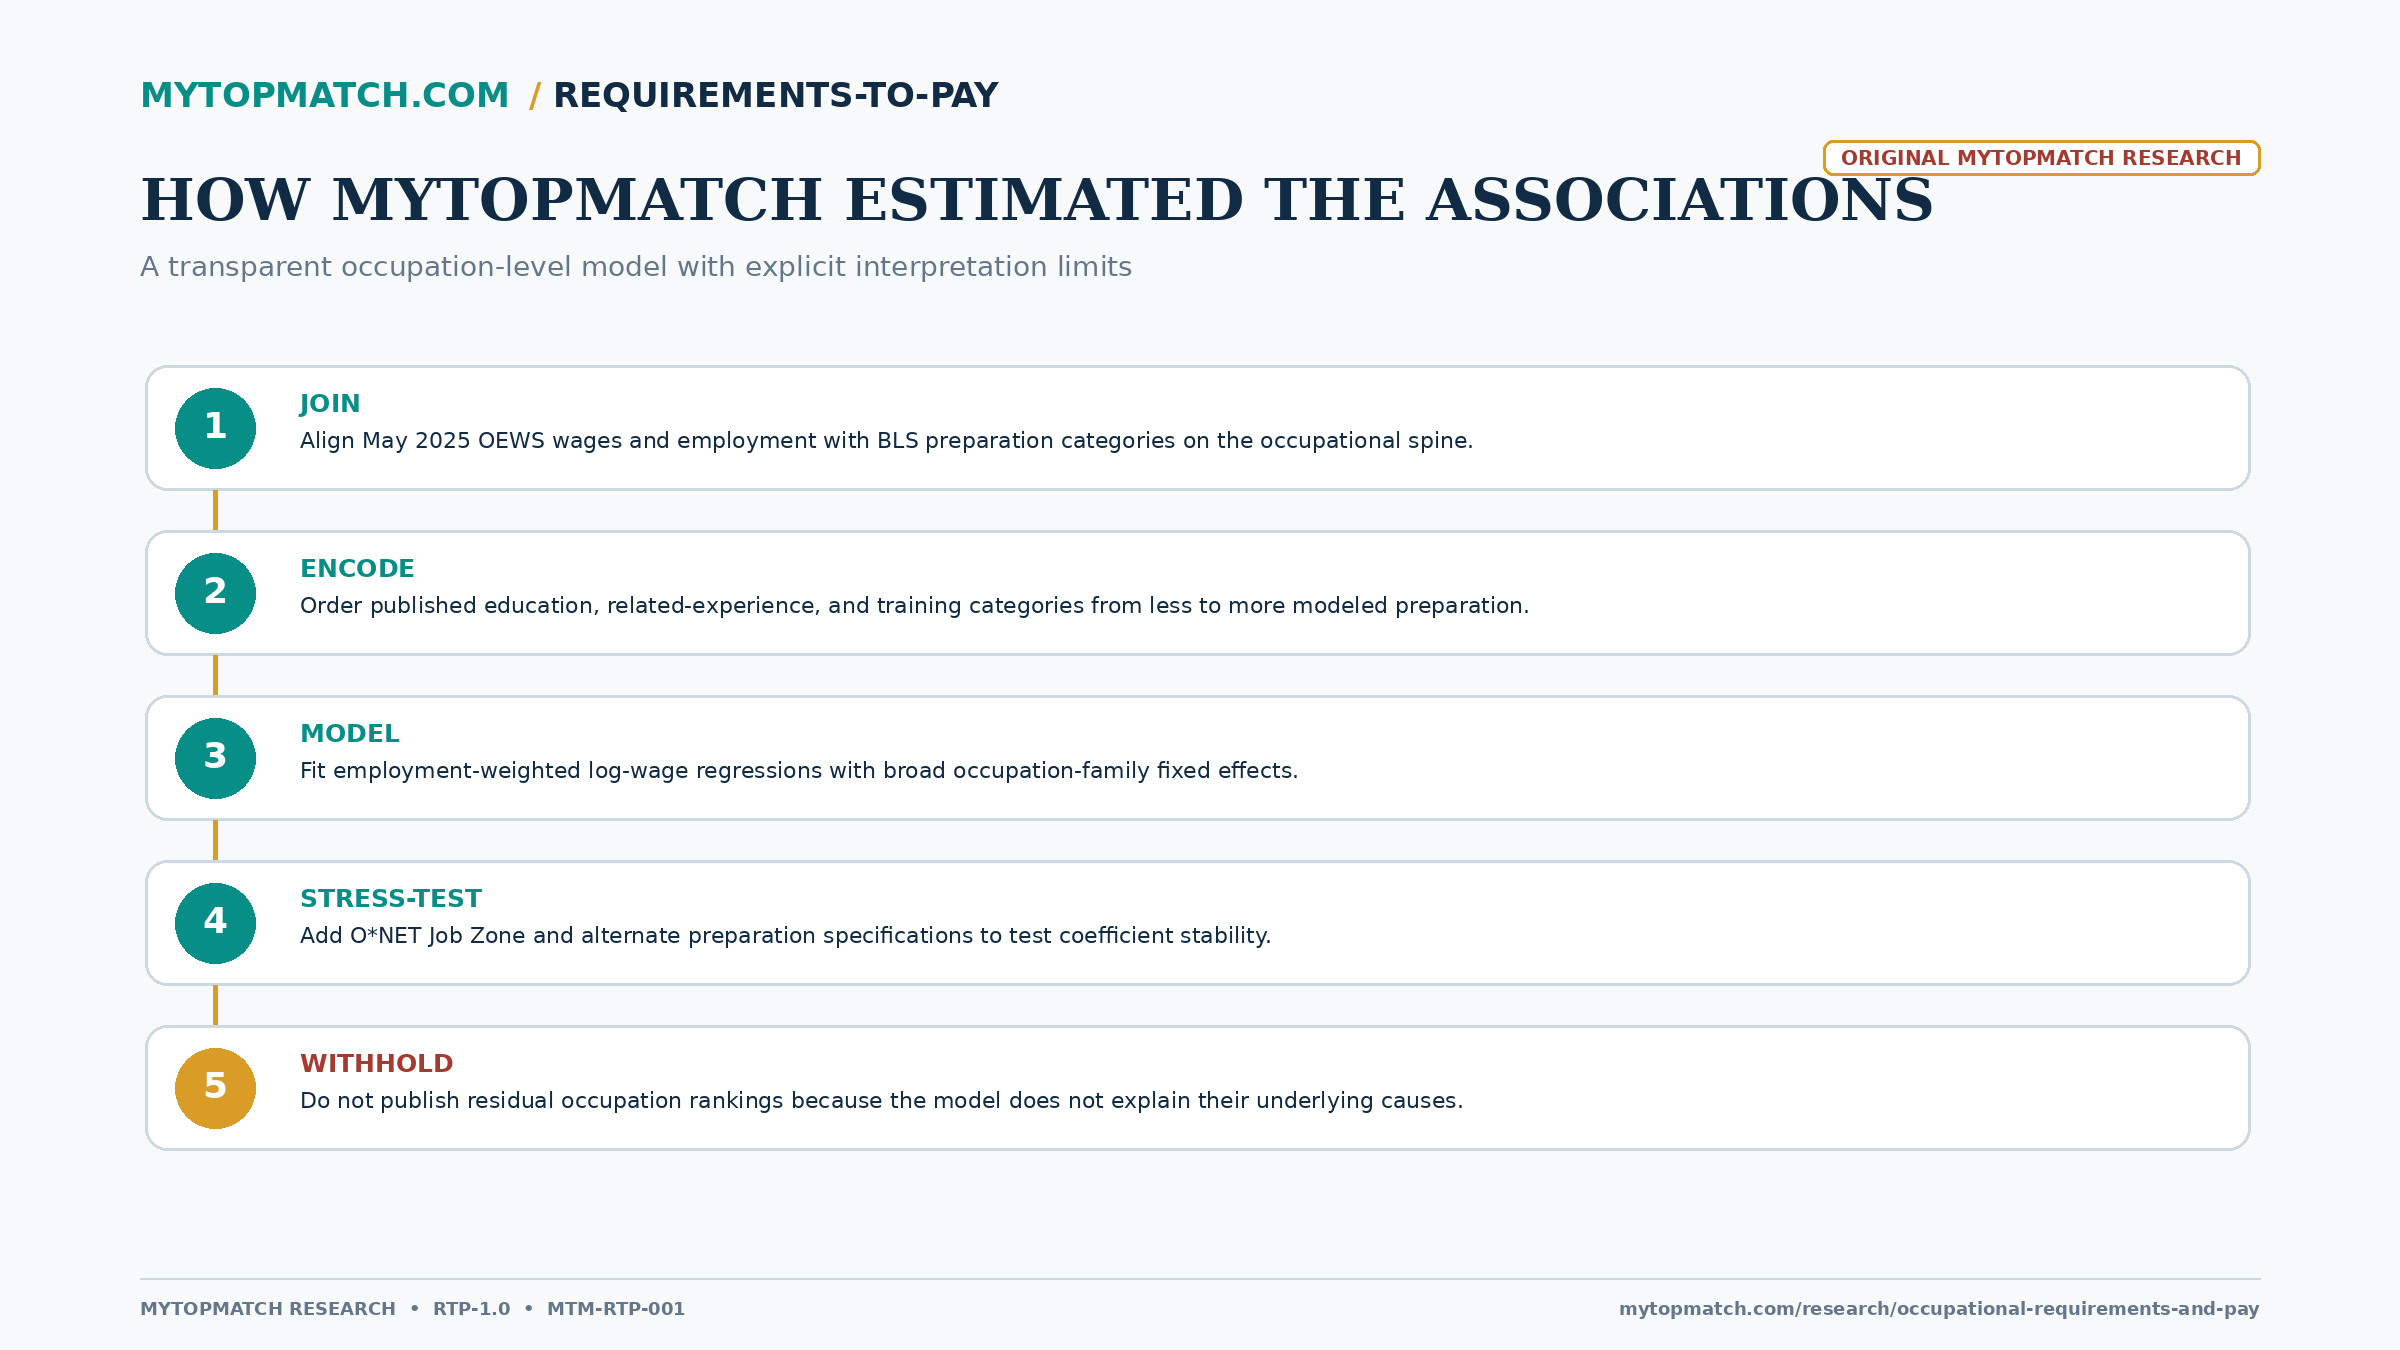
The unit is a detailed occupation aligned to the 2018 SOC occupational spine. The dependent variable is the natural logarithm of the May 2025 OEWS median annual wage. Each occupation is weighted by its May 2025 OEWS employment estimate.
RTP-1.0 models education, related experience, and on-the-job training together with broad occupation-family fixed effects. MyTopMatch converted log coefficients to approximate percentage associations using 100 × (exp(beta) − 1). Sensitivity tests added O*NET Job Zone and examined alternate preparation specifications.
What this research cannot establish
- An individual's return to completing a degree or training program.
- A causal effect of education, experience, or training on pay.
- The education or experience actually held by every worker in an occupation.
- A specific employer's hiring requirements or screening decisions.
- Complete legal access across states and occupations.
- Total compensation, benefits, schedules, working conditions, or job quality.
- A fair-pay ranking derived from model residuals.
- Future occupational wages or individual employment outcomes.
Primary and sensitivity results
| Measure | Result | Correct reading |
|---|---|---|
| Complete-case occupations | 825 | Detailed occupations with matched wage and preparation data |
| Education-category association | 22.59% | Conditional occupation-level association |
| Related-experience association | 21.50% | Conditional occupation-level association |
| On-the-job-training association | 4.51% | Specification-sensitive occupation-level association |
| Weighted R-squared | 85.5% | In-sample weighted cross-occupation fit |
| Education with Job Zone | 15.0% | Sensitivity showing overlap among preparation measures |
Source: MyTopMatch RTP-1.0 using May 2025 OEWS, BLS Employment Projections, and O*NET 31.0.
METHODOLOGY
How the analysis was built
Methodology RTP-1.0; finding MTM-RTP-001. Employment-weighted least squares models log May 2025 OEWS median wage using ordered BLS education, related-experience, and training categories with broad occupation-family fixed effects. HC3 standard errors and six alternative specifications test sensitivity. Coefficients are converted with 100 × (exp(beta) − 1).
Read the MyTopMatch research standards and methodology framework →
EVIDENCE STANDARD
How to read this research
- SOURCE DATA
- Facts reported by the cited government or occupational-data publishers.
- DERIVED CALCULATIONS
- Values calculated by MyTopMatch from the source data using the documented method.
- STATISTICAL FINDINGS
- Relationships that passed the stated analytical and validation checks.
- INTERPRETATION
- Practical meaning and hypotheses kept separate from directly observed facts.
FREQUENTLY ASKED QUESTIONS
Questions about the finding
Is 22.6% the return to earning another degree?
No. It is an occupation-level conditional association for one coded education-category step.
Why does Job Zone reduce the education estimate?
Job Zone overlaps with education, experience, and training, so adding it absorbs some shared preparation information.
Why are residual rankings withheld?
Residuals can reflect unmeasured licensing, working conditions, industry, geography, hours, scarcity, selection, and other omitted factors.
PRIMARY SOURCES
Sources and citations
- BLS Occupational Employment and Wage Statistics TablesU.S. Bureau of Labor Statistics
- BLS OEWS DocumentationU.S. Bureau of Labor Statistics
- BLS Education and Training Assignments by Detailed Occupation, 2025U.S. Bureau of Labor Statistics
- BLS Occupational Projections and Worker Characteristics, 2025–35U.S. Bureau of Labor Statistics
- O*NET 31.0 DatabaseU.S. Department of Labor, Employment and Training Administration
- O*NET 31.0 Database Content LicenseU.S. Department of Labor, Employment and Training AdministrationO*NET 31.0 is used under CC BY 4.0. MyTopMatch modified and combined some information; USDOL/ETA has not approved, endorsed, or tested those modifications.
Source agencies have not approved or endorsed MyTopMatch's transformations, analysis, or conclusions. BLS cannot vouch for analyses created from its data.
This page includes information from the O*NET 31.0 Database by the U.S. Department of Labor, Employment and Training Administration (USDOL/ETA), used under the CC BY 4.0 license. O*NET® is a trademark of USDOL/ETA. MyTopMatch modified and combined some information; USDOL/ETA has not approved, endorsed, or tested those modifications.
CITATION AND REUSE
Cite this original research
MyTopMatch Research. “Education and Experience Categories Track Higher Occupational Pay.” MyTopMatch Labor Market Research, 2026. Methodology RTP-1.0. Finding MTM-RTP-001. https://mytopmatch.com/research/occupational-requirements-and-pay.
When quoting, summarizing, or reproducing MyTopMatch-created analysis, identify MyTopMatch Research as the analyst and link to this canonical page. The cited government agencies and O*NET remain the underlying data publishers.
MEDIA AND SOCIAL ASSETS
Download the graphics package
These approved assets are ready for website, newsroom, and later social use. Social distribution remains a separate publication action.
- Complete Article #5 graphics packageAll 25 PNG assets, three editable SVG charts, brand references, carousel, manifest, and citation guidance.
- Open Graph / Facebook graphic1200 × 630 branded link-preview asset.
- LinkedIn landscape graphic1200 × 627 landscape promotional asset.
- LinkedIn portrait graphic1080 × 1350 portrait promotional asset.
- Instagram square1080 × 1080 square campaign asset.
- Stories / Reels graphic1080 × 1920 vertical campaign asset.
- Press thumbnail800 × 450 newsroom and media asset.
- Carousel coverFirst of six 1080 × 1350 carousel slides included in the complete package.