KEY FINDINGS
The finding at a glance
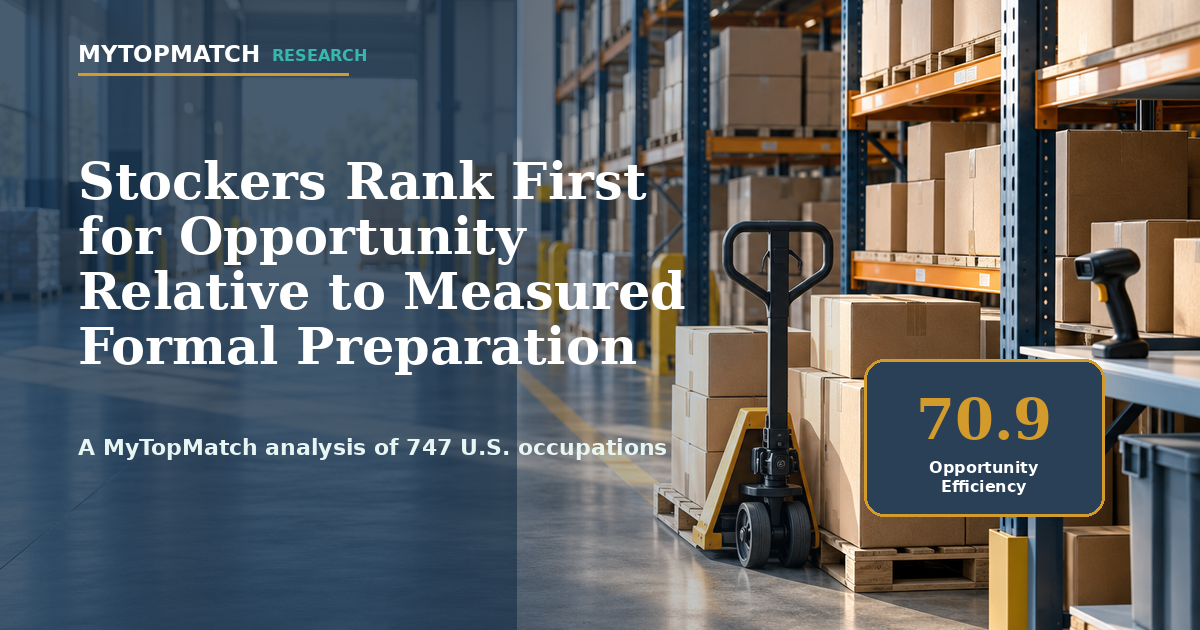
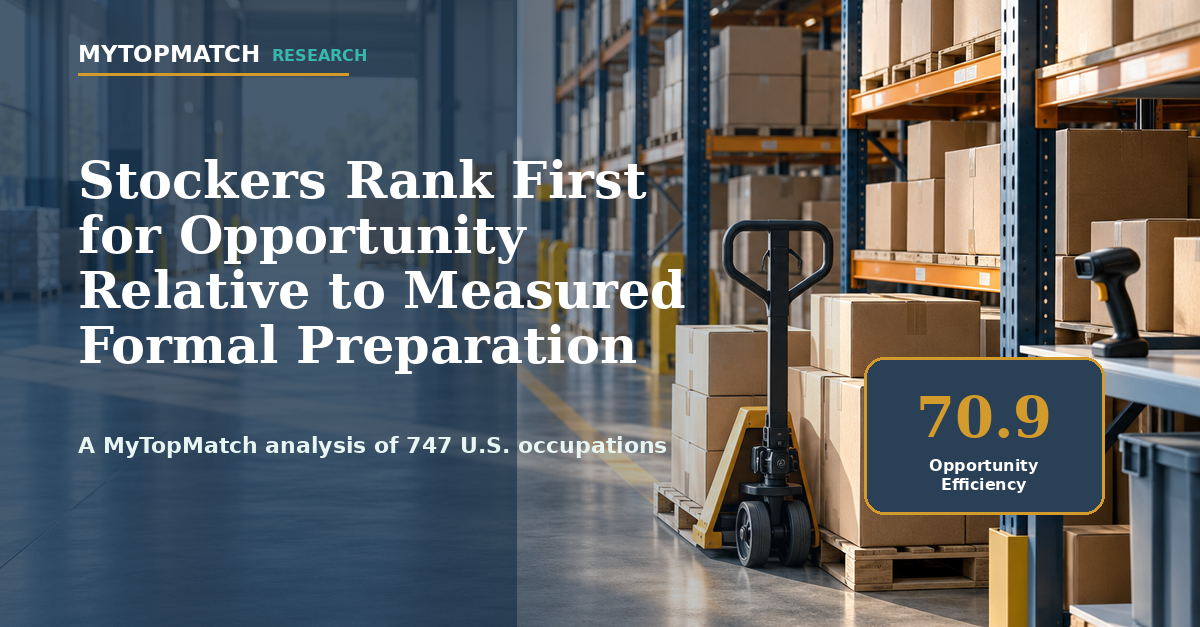
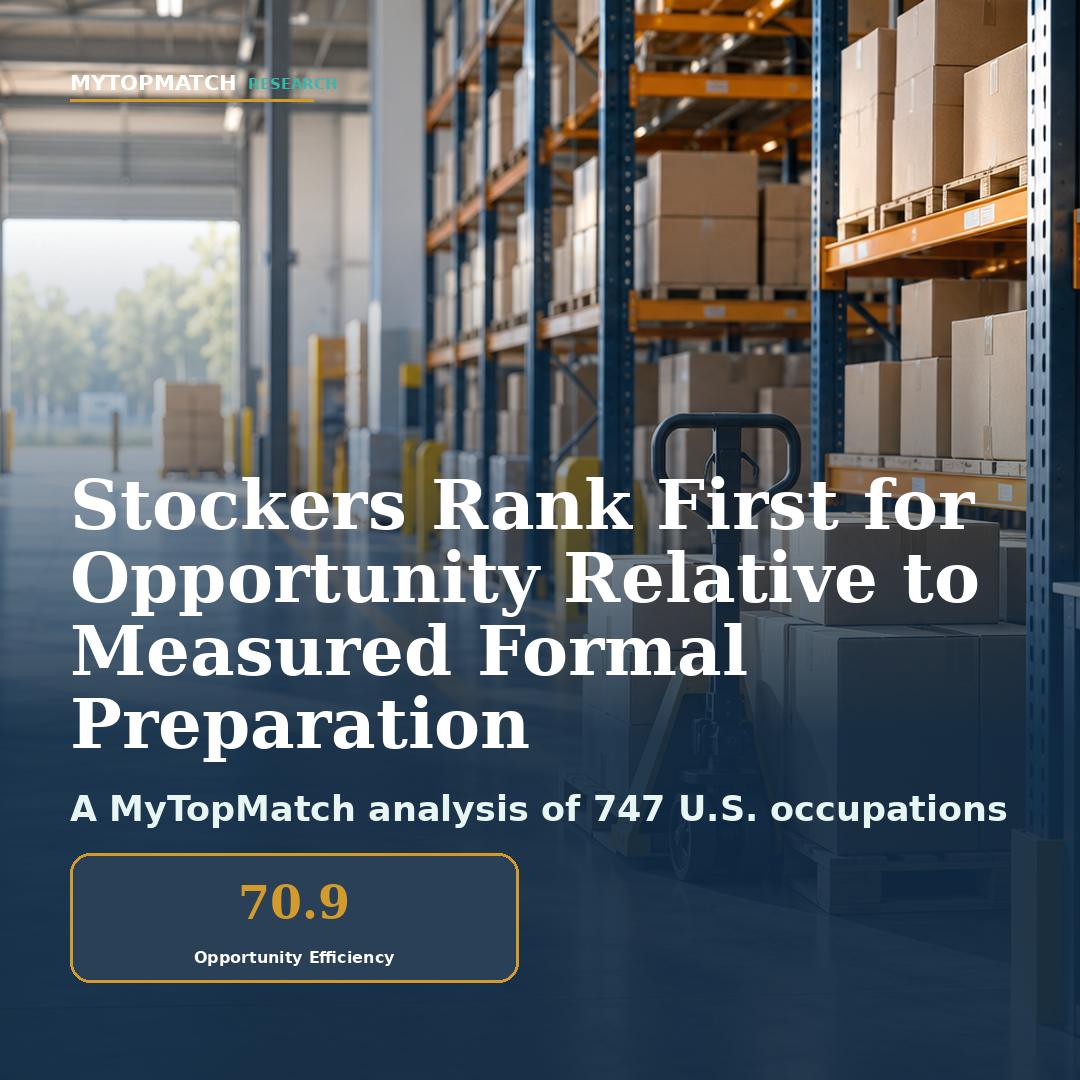
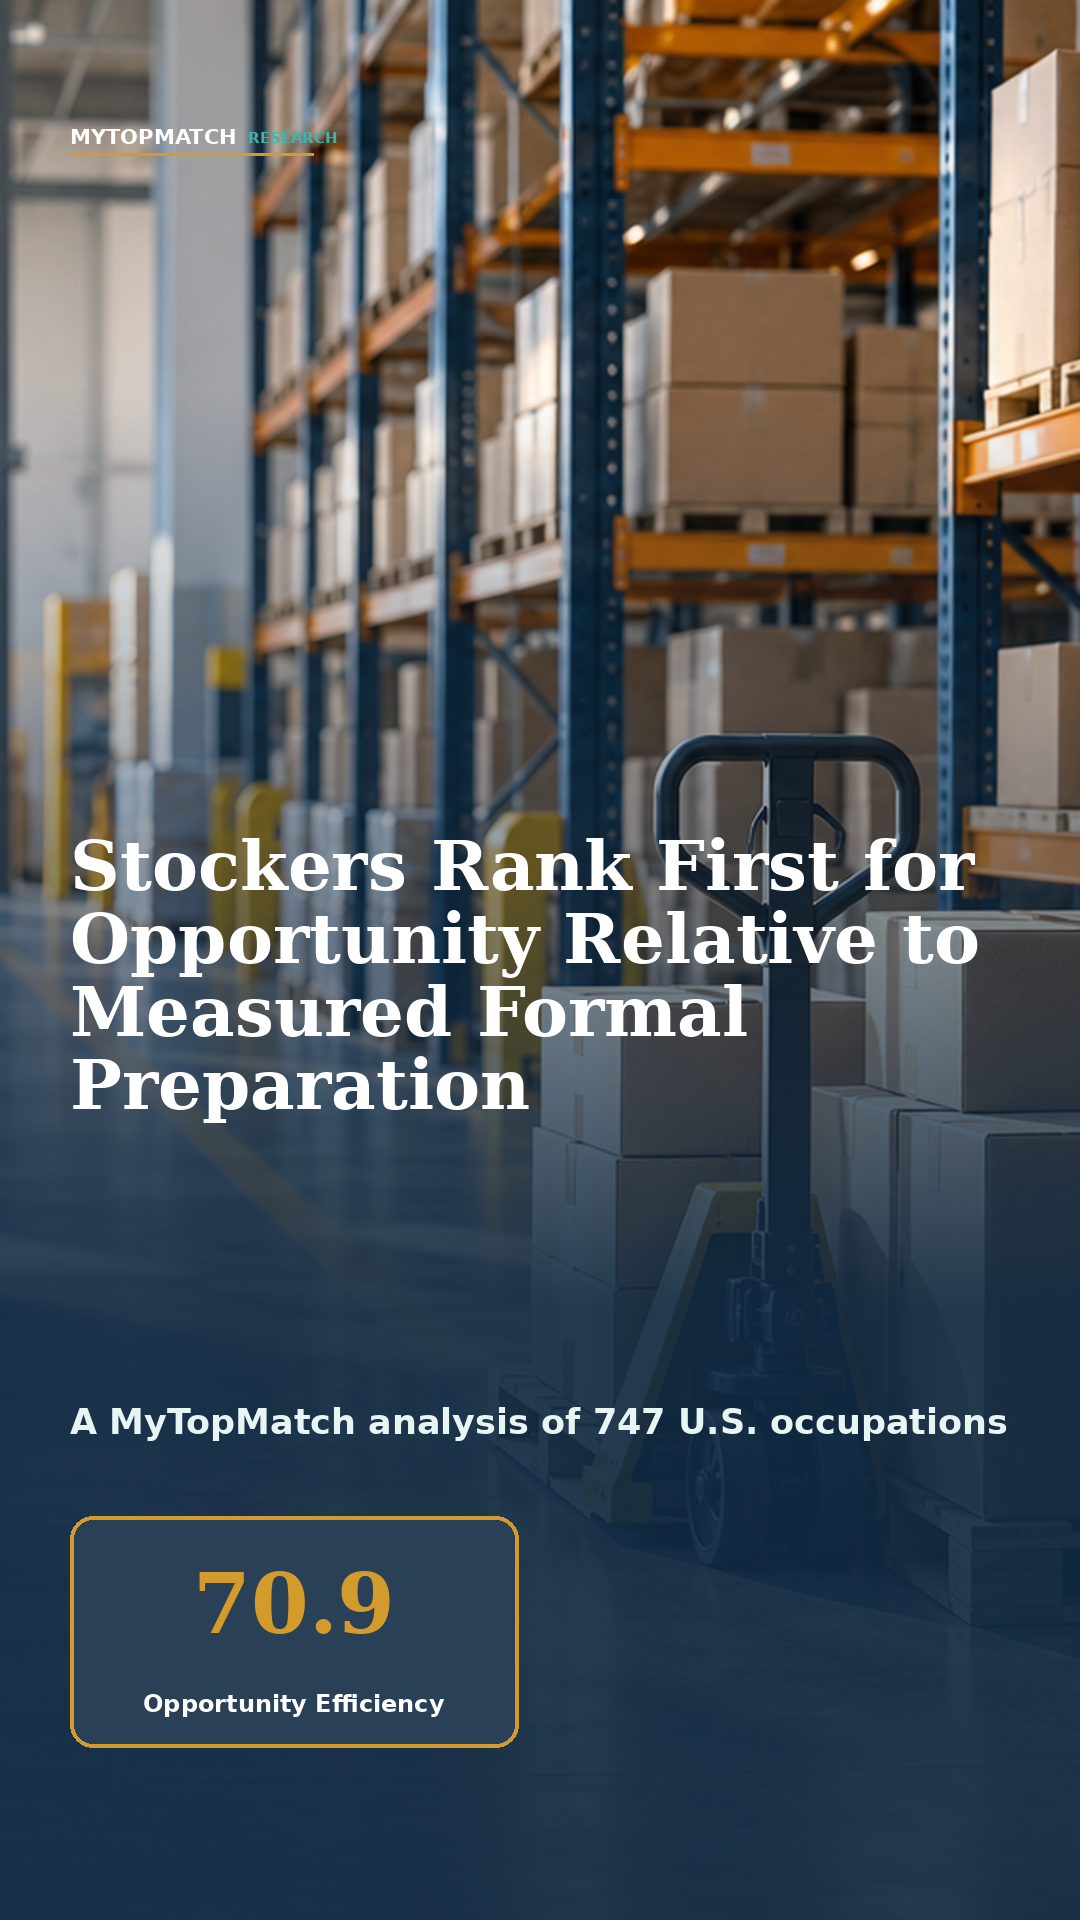
Stockers and order fillers led the complete-case Opportunity Efficiency ranking.
Opportunity 79.27 minus Barrier 37.50, centered through the frozen formula.
The leader remained in the top four in every leave-one-component-out test.
The visible component prevents the overall result from being mistaken for a high-pay ranking.
CHARTS AND GRAPHICS
The evidence in view
Each figure identifies the source, methodology record, and finding ID. Downloadable publication and social formats are available below.
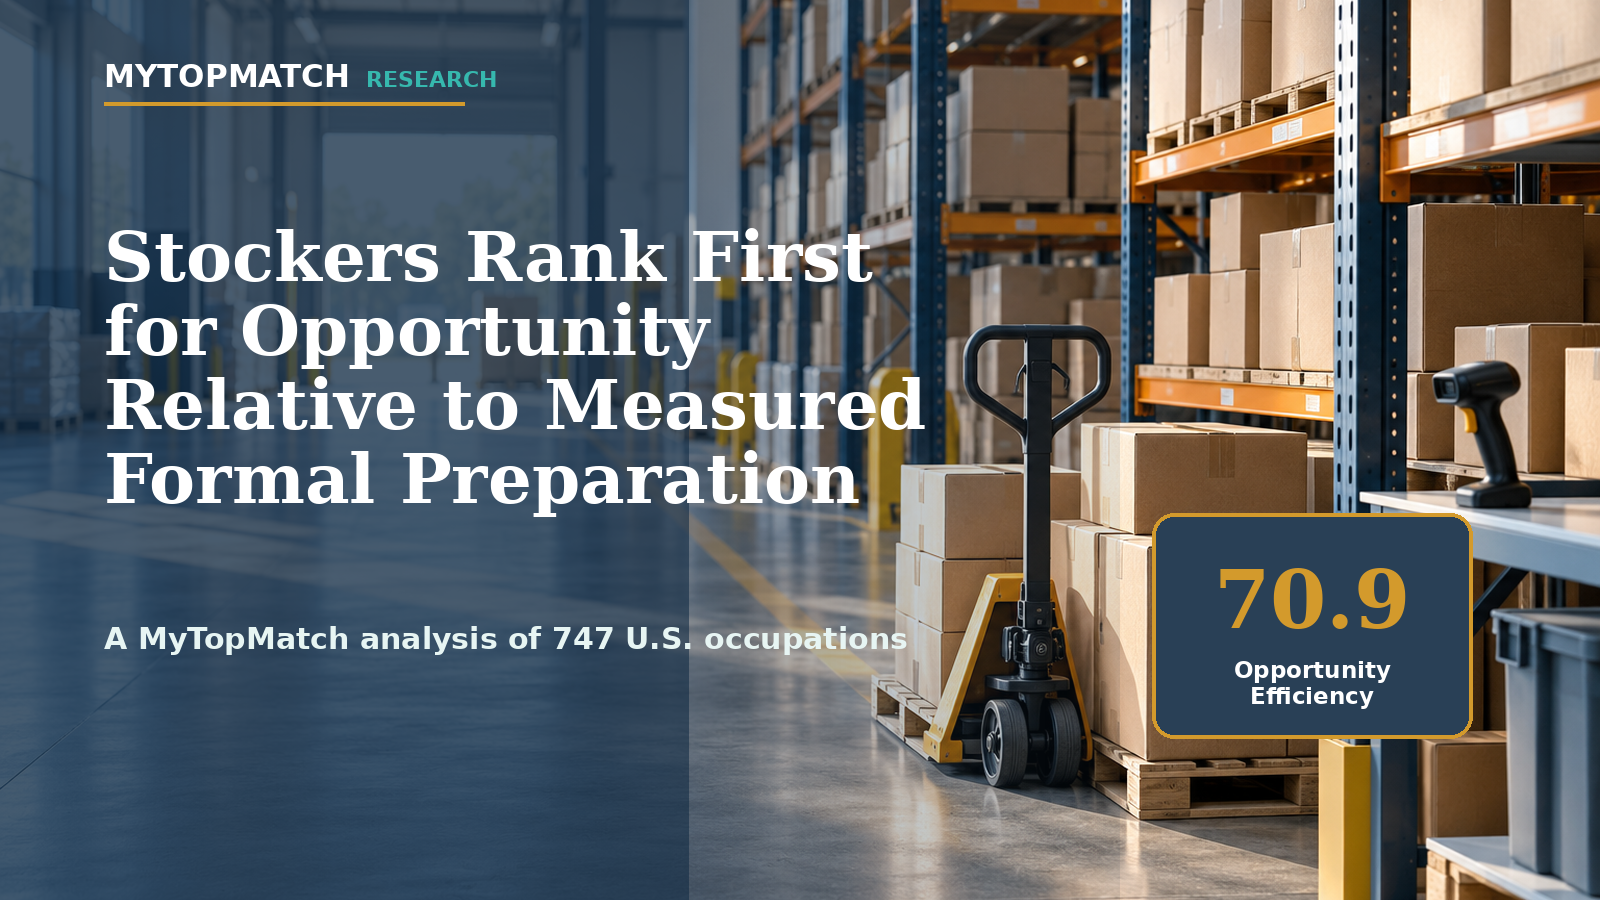
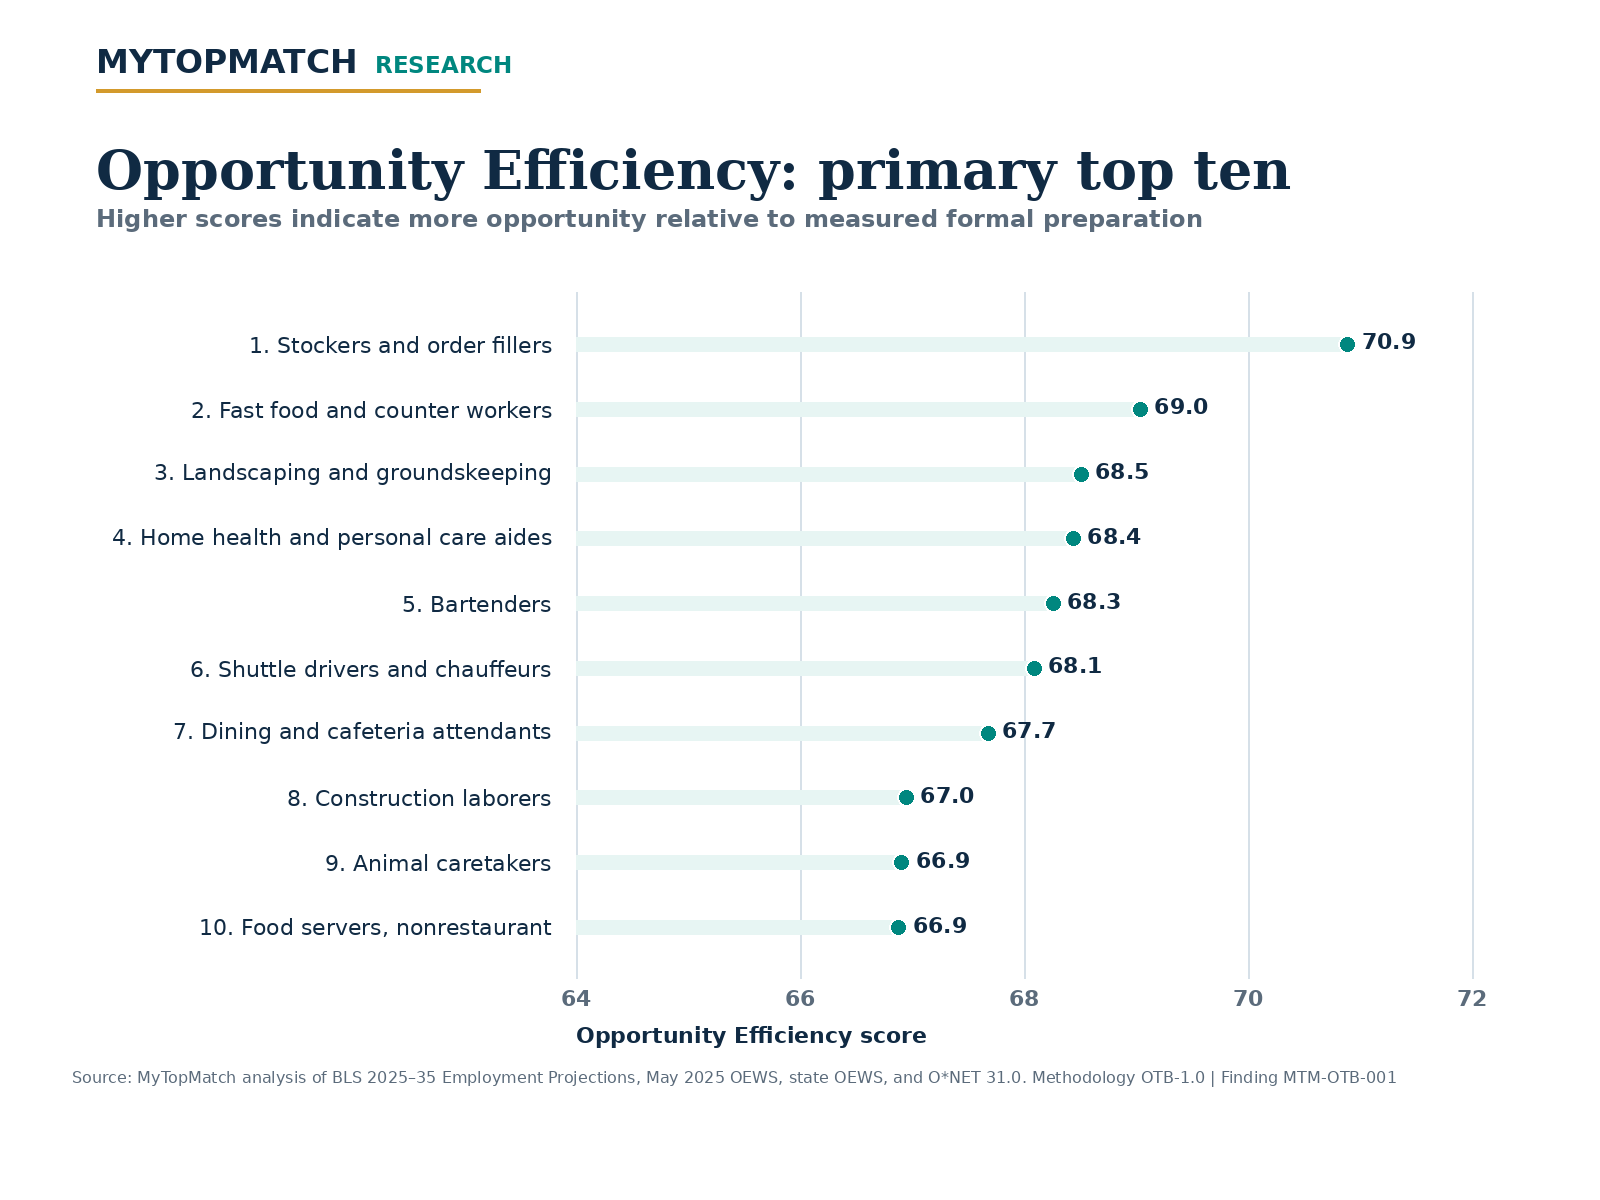
Stockers and order fillers ranked first among 747 complete-case occupations in MyTopMatch's Opportunity-to-Barrier Index. The occupation combined an Opportunity score of 79.27 with a measured Barrier score of 37.50, producing Opportunity Efficiency of 70.89, reported as 70.9.
The score reflects market scale, projected openings and growth, geographic breadth, compensation, and formal preparation. Stockers' pay component was 11.0 out of 100. The result therefore does not label the occupation the best career overall; it identifies a strong combination of scale and access under the defined measure.
The federal data behind the score
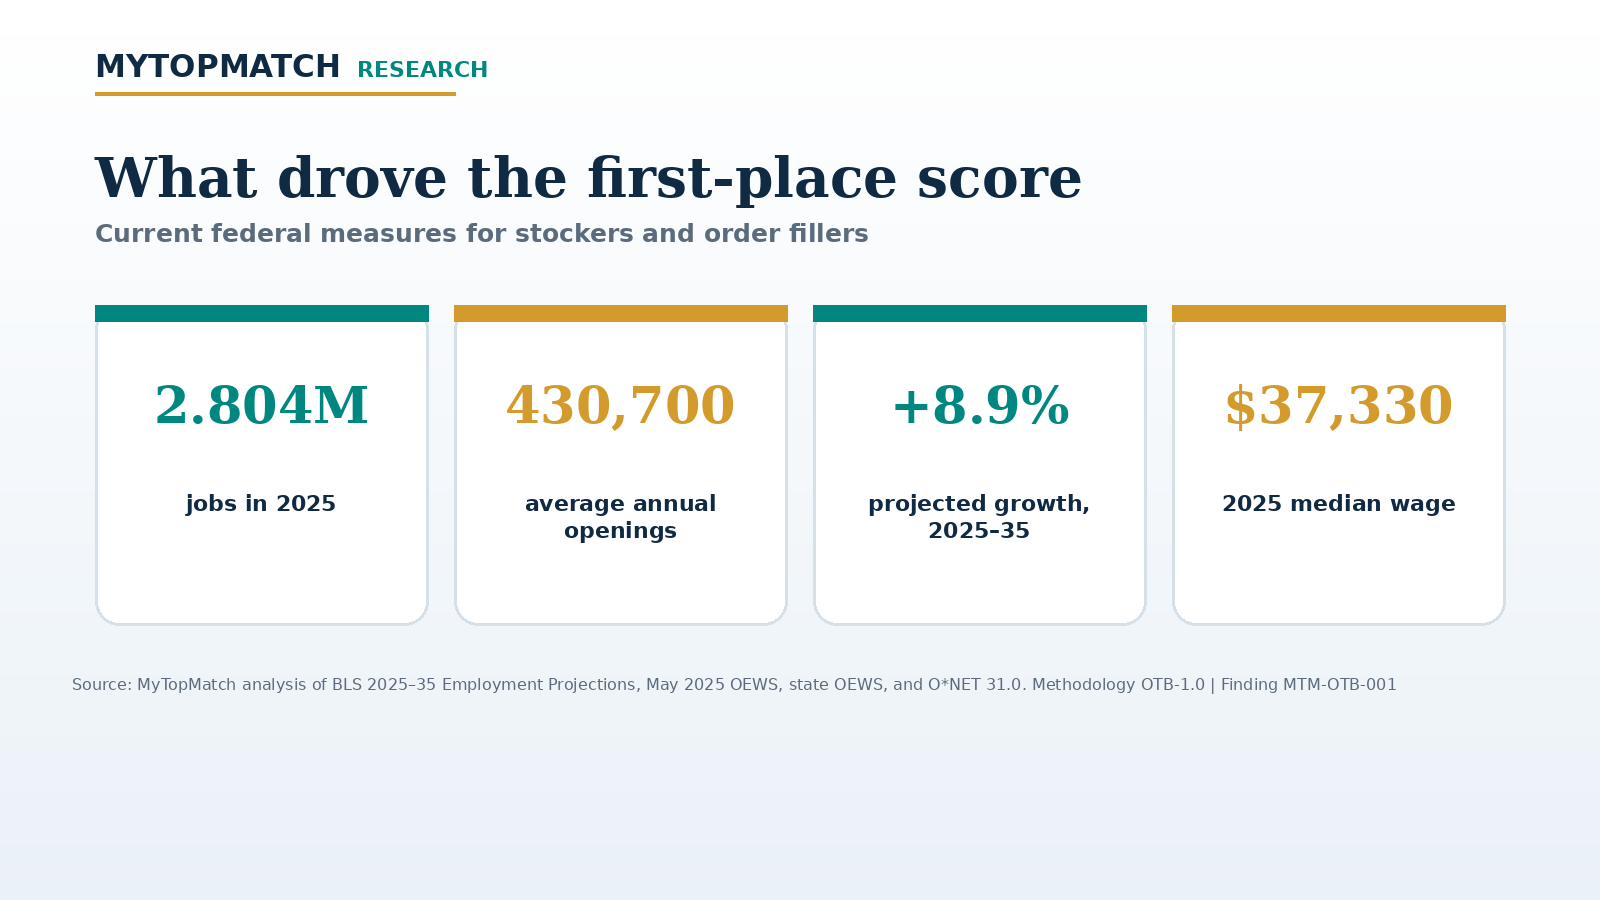
BLS reports 2.804 million stocker and order-filler jobs in 2025 and projects 3.055 million in 2035, an increase of 250,700 jobs or 8.9%. The agency projects an average of 430,700 openings per year over the decade. Openings include both occupational growth and replacement needs.
BLS classifies the occupation as typically requiring no formal educational credential, no related work experience, and short-term on-the-job training. O*NET assigns Job Zone 1–2, indicating very little to some preparation. These are national occupation-level classifications; individual employers can set different requirements.
Pay is the central counterweight
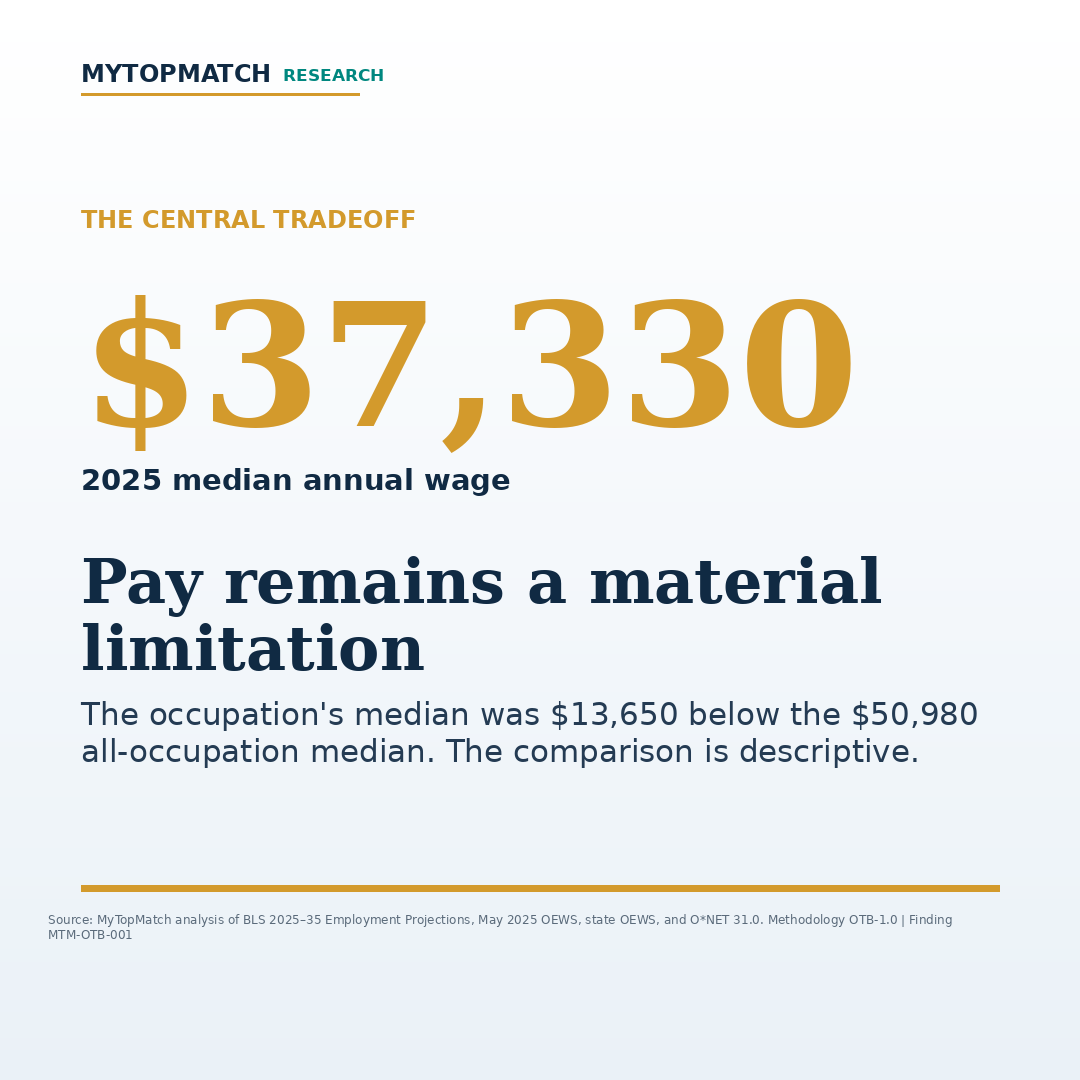
The 2025 median annual wage for stockers and order fillers was $37,330, compared with $50,980 across all occupations. The $13,650 difference helps explain the occupation's pay component of 11.0. The comparison is descriptive and does not adjust for hours, geography, industry, shift differentials, benefits, union coverage, or worker characteristics.
Opportunity and barrier remain visible
The Opportunity pillar gives equal weight to median pay, openings rate, log annual openings, projected growth, log employment scale, and geographic breadth. The Barrier pillar gives equal weight to BLS typical entry education, related work experience, on-the-job training, and O*NET Job Zone.
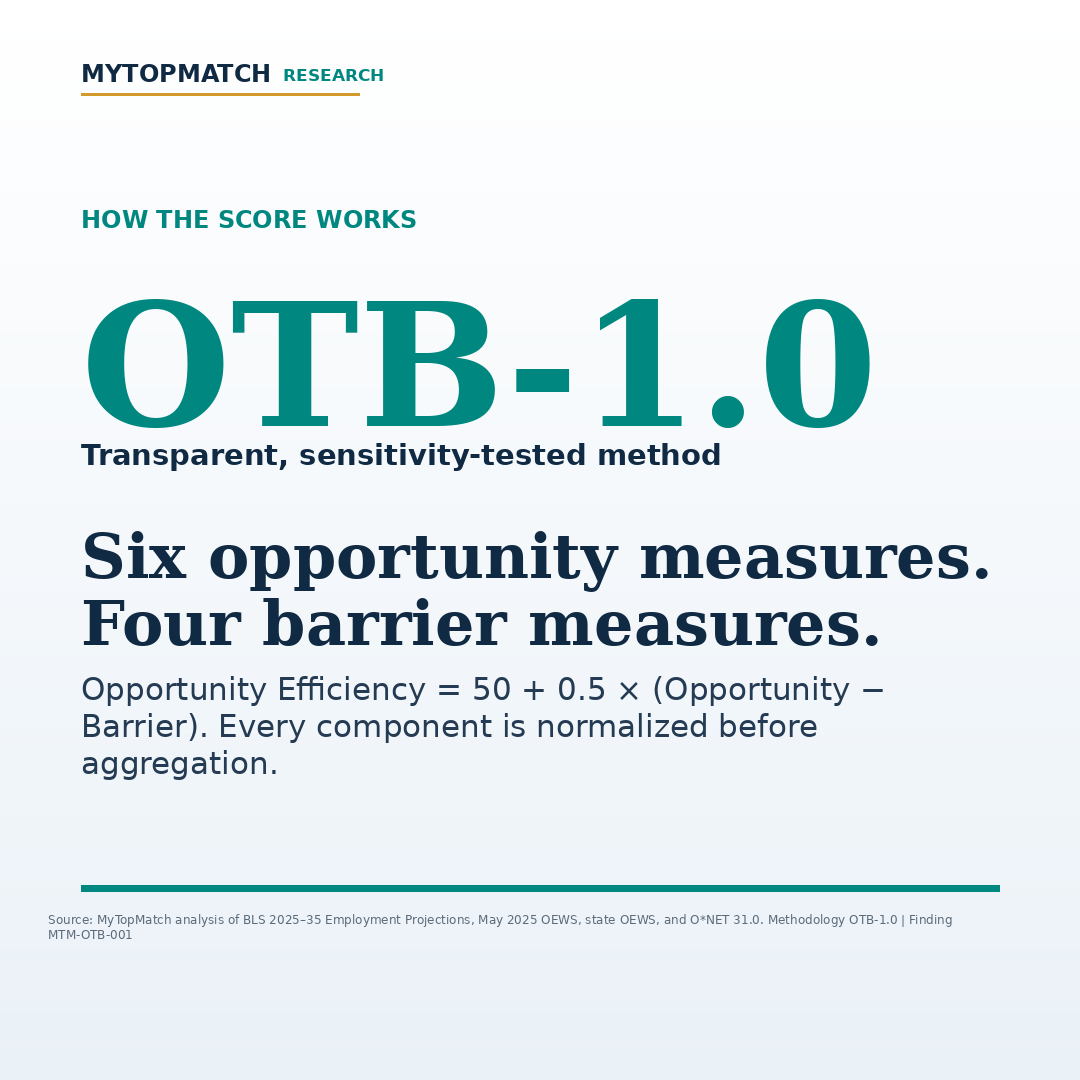
Highly skewed count variables are log transformed. Each component is oriented so a higher value means more of the named construct, converted to a robust z-score, and mapped through the standard normal cumulative distribution to a 0–100 score. Opportunity Efficiency equals 50 plus one-half of the difference between Opportunity and Barrier.
The leader was stable; exact ranks were less stable
Stockers and order fillers ranked between first and fourth when each component was omitted in turn. The broader table moved more under reasonable alternatives: the weakest top-decile retention was 64%, and the median span between an occupation's 5th- and 95th-percentile simulated ranks was 69 positions.
MyTopMatch therefore emphasizes high-scoring tiers, component values, and sensitivity measures. A tenth of an index point should not be read as a meaningful difference in a worker's lived opportunity.
The top ten form a close group
The first ten occupations are separated by roughly four Opportunity Efficiency points. Fast food and counter workers ranked second at 69.04, followed by landscaping and groundskeeping workers at 68.51. Small changes in reasonable modeling choices can alter the order, so the table is best read as a high-scoring tier.
What the work involves
BLS and O*NET describe stockers and order fillers as receiving, unpacking, tracking, moving, and inspecting merchandise; stocking shelves; filling orders; and maintaining records. Reported technology skills include inventory and warehouse-management systems, handheld devices, and spreadsheets. The work can also involve lifting, carrying, repetitive tasks, bending, kneeling, crouching, and variable schedules.
Licensing and job quality are outside the primary score
The primary Barrier score measures typical formal preparation. It does not contain a nationally complete occupation-by-state legal-requirement matrix. Missing licensing records are never treated as evidence that no license exists. The public result also omits benefits, schedule predictability, injury risk, turnover, worker voice, commuting constraints, and advancement quality.
How to use the result
A job seeker can use a high score to begin a local investigation: review current openings, hourly pay, scheduled hours, benefits, physical demands, training, equipment and software expectations, transportation, and advancement paths. Employers and workforce organizations can examine which screens predict retention, safety, performance, and progression.
- Compare posted hourly pay, scheduled hours, shift premiums, benefits, and overtime expectations.
- Verify lifting, standing, equipment, temperature, safety, background, age, and driving requirements.
- Document experience with inventory, fulfillment, scanners, warehouse systems, customer service, and material-handling equipment.
- Investigate advancement paths into inventory control, shipping and receiving, logistics, supervision, and specialized equipment roles.
What this research cannot establish
- A personal hiring probability or fit judgment.
- Universal employer requirements or complete legal access.
- Job quality or advancement quality.
- A causal effect of low formal preparation on opportunity.
- A permanent ranking under future releases or every reasonable specification.
Primary Opportunity-to-Barrier top ten
| Rank | Occupation | Opportunity | Barrier | Efficiency |
|---|---|---|---|---|
| 1 | Stockers and order fillers | 79.27 | 37.50 | 70.89 |
| 2 | Fast food and counter workers | 75.58 | 37.50 | 69.04 |
| 3 | Landscaping and groundskeeping workers | 74.51 | 37.50 | 68.51 |
| 4 | Home health and personal care aides | 80.62 | 43.75 | 68.44 |
| 5 | Bartenders | 74.01 | 37.50 | 68.26 |
| 6 | Shuttle drivers and chauffeurs | 73.68 | 37.50 | 68.09 |
| 7 | Dining room and cafeteria attendants and bartender helpers | 72.86 | 37.50 | 67.68 |
| 8 | Construction laborers | 71.40 | 37.50 | 66.95 |
| 9 | Animal caretakers | 77.56 | 43.75 | 66.91 |
| 10 | Food servers, nonrestaurant | 71.26 | 37.50 | 66.88 |
Source: MyTopMatch OTB-1.0 using BLS 2025–35 Employment Projections, May 2025 OEWS, and O*NET 31.0.
METHODOLOGY
How the analysis was built
Methodology OTB-1.0; finding MTM-OTB-001. Ten inputs are robust-CDF normalized. Opportunity and Barrier remain separate, and Opportunity Efficiency = 50 + 0.5 × (Opportunity − Barrier). Complete source outcomes and a mapped O*NET Job Zone are required. Licensing is excluded from the public primary score because nationally complete occupation-by-state coverage is unavailable.
Read the MyTopMatch research standards and methodology framework →
EVIDENCE STANDARD
How to read this research
- SOURCE DATA
- Facts reported by the cited government or occupational-data publishers.
- DERIVED CALCULATIONS
- Values calculated by MyTopMatch from the source data using the documented method.
- STATISTICAL FINDINGS
- Relationships that passed the stated analytical and validation checks.
- INTERPRETATION
- Practical meaning and hypotheses kept separate from directly observed facts.
FREQUENTLY ASKED QUESTIONS
Questions about the finding
Does rank one mean stockers have the best job prospects in America?
It means the occupation ranked first on this defined measure of opportunity relative to measured formal preparation. Pay, working conditions, local demand, fit, and mobility remain separate considerations.
Why include both openings and employment size?
They measure different constructs: expected hiring needs and the scale of the existing market. An openings-rate component reduces the advantage of size alone.
Why is licensing outside the primary score?
No nationally complete occupation-by-state licensing matrix passed the coverage gate. Missing records are not scored as zero burden.
PRIMARY SOURCES
Sources and citations
- BLS Occupational Projections and Worker Characteristics, 2025–35U.S. Bureau of Labor Statistics
- BLS Education and Training Assignments by Detailed Occupation, 2025U.S. Bureau of Labor Statistics
- BLS Occupational Employment and Wage Statistics TablesU.S. Bureau of Labor Statistics
- O*NET 31.0 DatabaseU.S. Department of Labor, Employment and Training Administration
- O*NET 31.0 Database Content LicenseU.S. Department of Labor, Employment and Training AdministrationO*NET 31.0 is used under CC BY 4.0. MyTopMatch modified and combined some information; USDOL/ETA has not approved, endorsed, or tested those modifications.
Source agencies have not approved or endorsed MyTopMatch's transformations, analysis, or conclusions. BLS cannot vouch for analyses created from its data.
This page includes information from the O*NET 31.0 Database by the U.S. Department of Labor, Employment and Training Administration (USDOL/ETA), used under the CC BY 4.0 license. O*NET® is a trademark of USDOL/ETA. MyTopMatch modified and combined some information; USDOL/ETA has not approved, endorsed, or tested those modifications.
CITATION AND REUSE
Cite this original research
MyTopMatch Research. “Stockers Rank First for Opportunity Relative to Measured Formal Preparation.” MyTopMatch Labor Market Research, 2026. Methodology OTB-1.0. Finding MTM-OTB-001. https://mytopmatch.com/research/opportunity-to-barrier-index-2026.
When quoting, summarizing, or reproducing MyTopMatch-created analysis, identify MyTopMatch Research as the analyst and link to this canonical page. The cited government agencies and O*NET remain the underlying data publishers.
MEDIA AND SOCIAL ASSETS
Download the graphics package
These approved assets are ready for website, newsroom, and later social use. Social distribution remains a separate publication action.
- Complete Article #4 graphics packageAll 22 publication, chart, social, press, and carousel assets with manifest, alt text, and citation guidance.
- Open Graph / Facebook graphic1200 × 630 branded link-preview asset.
- LinkedIn graphic1200 × 627 landscape promotional asset.
- Instagram square1080 × 1080 square campaign asset.
- Instagram portrait1080 × 1350 portrait campaign asset.
- Stories / Reels graphic1080 × 1920 vertical campaign asset.
- Press card1200 × 627 media and newsroom asset.
- Carousel coverFirst of seven 1080 × 1350 carousel slides included in the complete package.